``` yaml
scheduler:
infer_every: "1m"
fit_every: "2h"
fit_window: "14d"
model:
class: "model.prophet.ProphetModel"
args:
interval_width: 0.98
reader:
datasource_url: "http://victoriametrics:8428/"
queries:
node_cpu_rate: "rate(node_cpu_seconds_total)"
writer:
datasource_url: "http://victoriametrics:8428/"
```
## 6. vmanomaly output
As the result of running vmanomaly, it produces the following metrics:
- `anomaly_score` - the main one. Ideally, if it is between 0.0 and 1.0 it is considered to be a non-anomalous value. If it is greater than 1.0, it is considered an anomaly (but you can reconfigure that in alerting config, of course),
- `yhat` - predicted expected value,
- `yhat_lower` - predicted lower boundary,
- `yhat_upper` - predicted upper boundary,
- `y` - initial query result value.
Here is an example of how output metric will be written into VictoriaMetrics:
`anomaly_score{for="node_cpu_rate", cpu="0", instance="node-xporter:9100", job="node-exporter", mode="idle"} 0.85`
## 7. vmalert configuration
Here we provide an example of the config for vmalert `vmalert_config.yml`.
``` yaml
groups:
- name: AnomalyExample
rules:
- alert: HighAnomalyScore
expr: 'anomaly_score > 1.0'
labels:
severity: warning
annotations:
summary: Anomaly Score exceeded 1.0. `rate(node_cpu_seconds_total)` is showing abnormal behavior.
```
In the query expression we need to put a condition on the generated anomaly scores. Usually if the anomaly score is between 0.0 and 1.0, the analyzed value is not abnormal. The more anomaly score exceeded 1 the more our model is sure that value is an anomaly.
You can choose your threshold value that you consider reasonable based on the anomaly score metric, generated by vmanomaly. One of the best ways is to estimate it visually, by plotting the `anomaly_score` metric, along with predicted "expected" range of `yhat_lower` and `yhat_upper`. Later in this tutorial we will show an example
## 8. Docker Compose configuration
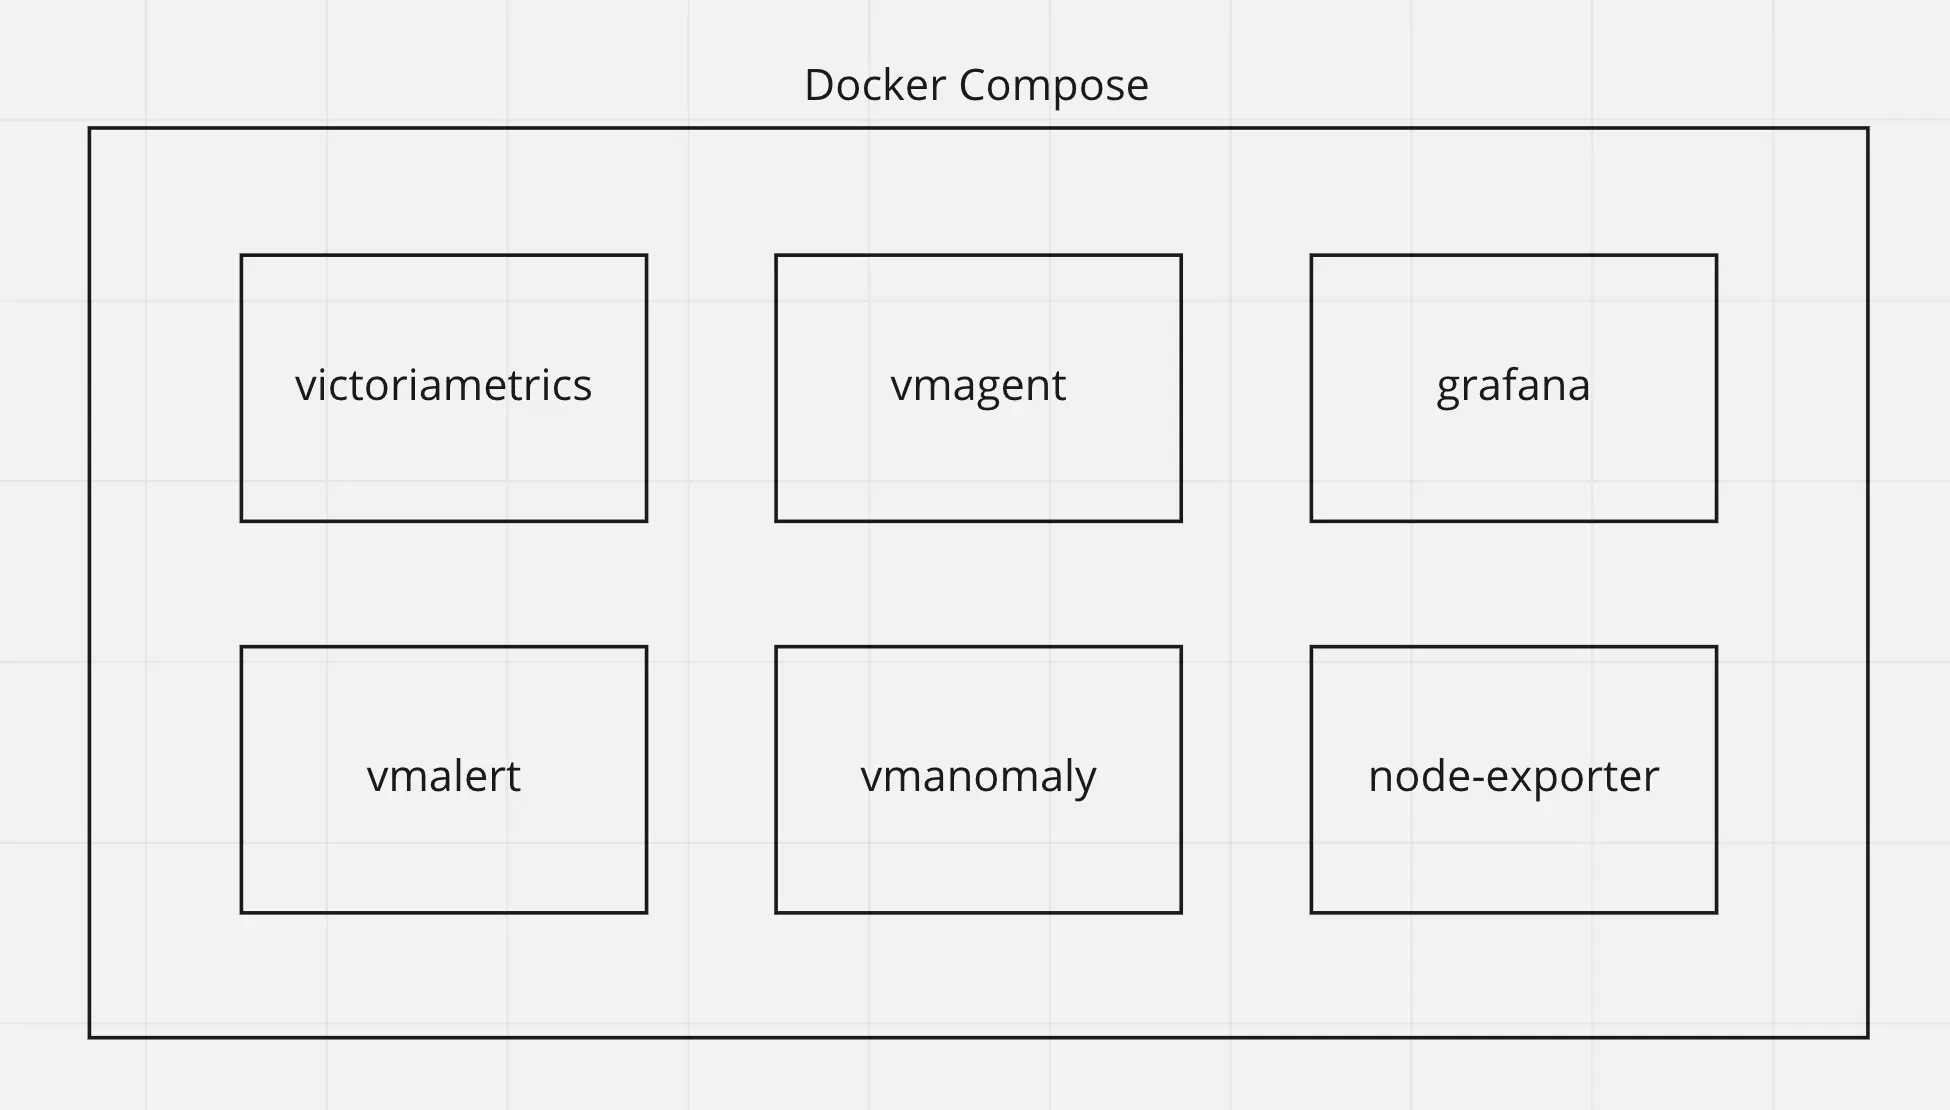
Now we are going to configure the `docker-compose.yml` file to run all needed services.
Here are all services we are going to run:
``` yaml
apiVersion: 1
datasources:
- name: VictoriaMetrics
type: prometheus
access: proxy
url: http://victoriametrics:8428
isDefault: true
```
### Scrape config
Let's create `prometheus.yml` file for `vmagent` configuration.
``` yaml
global:
scrape_interval: 10s
scrape_configs:
- job_name: 'vmagent'
static_configs:
- targets: ['vmagent:8429']
- job_name: 'vmalert'
static_configs:
- targets: ['vmalert:8880']
- job_name: 'victoriametrics'
static_configs:
- targets: ['victoriametrics:8428']
- job_name: 'node-exporter'
static_configs:
- targets: ['node-exporter:9100']
- job_name: 'vmanomaly'
static_configs:
- targets: [ 'vmanomaly:8500' ]
```
### vmanomaly licencing
We are going to use license stored locally in file `vmanomaly_licence.txt` with key in it.
You can explore other license options [here](https://docs.victoriametrics.com/vmanomaly.html#licensing)
### Docker-compose
Let's wrap it all up together into the `docker-compose.yml` file.
``` yaml
services:
vmagent:
container_name: vmagent
image: victoriametrics/vmagent:latest
depends_on:
- "victoriametrics"
ports:
- 8429:8429
volumes:
- vmagentdata:/vmagentdata
- ./prometheus.yml:/etc/prometheus/prometheus.yml
command:
- "--promscrape.config=/etc/prometheus/prometheus.yml"
- "--remoteWrite.url=http://victoriametrics:8428/api/v1/write"
networks:
- vm_net
restart: always
victoriametrics:
container_name: victoriametrics
image: victoriametrics/victoria-metrics:v1.96.0
ports:
- 8428:8428
- 8089:8089
- 8089:8089/udp
- 2003:2003
- 2003:2003/udp
- 4242:4242
volumes:
- vmdata:/storage
command:
- "--storageDataPath=/storage"
- "--graphiteListenAddr=:2003"
- "--opentsdbListenAddr=:4242"
- "--httpListenAddr=:8428"
- "--influxListenAddr=:8089"
- "--vmalert.proxyURL=http://vmalert:8880"
networks:
- vm_net
restart: always
grafana:
container_name: grafana
image: grafana/grafana-oss:10.2.1
depends_on:
- "victoriametrics"
ports:
- 3000:3000
volumes:
- grafanadata:/var/lib/grafana
- ./datasource.yml:/etc/grafana/provisioning/datasources/datasource.yml
networks:
- vm_net
restart: always
vmalert:
container_name: vmalert
image: victoriametrics/vmalert:latest
depends_on:
- "victoriametrics"
ports:
- 8880:8880
volumes:
- ./vmalert_config.yml:/etc/alerts/alerts.yml
command:
- "--datasource.url=http://victoriametrics:8428/"
- "--remoteRead.url=http://victoriametrics:8428/"
- "--remoteWrite.url=http://victoriametrics:8428/"
- "--notifier.url=http://alertmanager:9093/"
- "--rule=/etc/alerts/*.yml"
# display source of alerts in grafana
- "--external.url=http://127.0.0.1:3000" #grafana outside container
# when copypaste the line be aware of '$$' for escaping in '$expr'
- '--external.alert.source=explore?orgId=1&left=["now-1h","now","VictoriaMetrics",{"expr":{{$$expr|jsonEscape|queryEscape}} },{"mode":"Metrics"},{"ui":[true,true,true,"none"]}]'
networks:
- vm_net
restart: always
vmanomaly:
container_name: vmanomaly
image: us-docker.pkg.dev/victoriametrics-test/public/vmanomaly-trial:v1.7.2
depends_on:
- "victoriametrics"
ports:
- "8500:8500"
networks:
- vm_net
restart: always
volumes:
- ./vmanomaly_config.yml:/config.yaml
- ./vmanomaly_license.txt:/license.txt
platform: "linux/amd64"
command:
- "/config.yaml"
- "--license-file=/license.txt"
node-exporter:
image: quay.io/prometheus/node-exporter:latest
container_name: node-exporter
ports:
- 9100:9100
pid: host
restart: unless-stopped
networks:
- vm_net
volumes:
vmagentdata: {}
vmdata: {}
grafanadata: {}
networks:
vm_net:
```
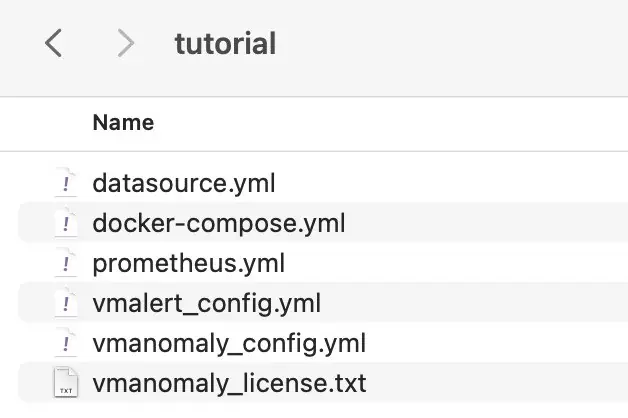
Before running our docker-compose make sure that your directory contains all required files:
```
docker-compose up -d
```
To check if vmanomaly is up and running you can check docker logs:
```
docker logs vmanomaly
```
## 9. Model results
To look at model results we need to go to grafana on the `localhost:3000`. Data
vmanomaly need some time to generate more data to visualize.
Let's investigate model output visualization in Grafana.
In the Grafana Explore tab enter queries:
* `anomaly_score`
* `yhat`
* `yhat_lower`
* `yhat_upper`
Each of these metrics will contain same labels our query `rate(node_cpu_seconds_total)` returns.
### Anomaly scores for each metric with its according labels.
Query: `anomaly_score`
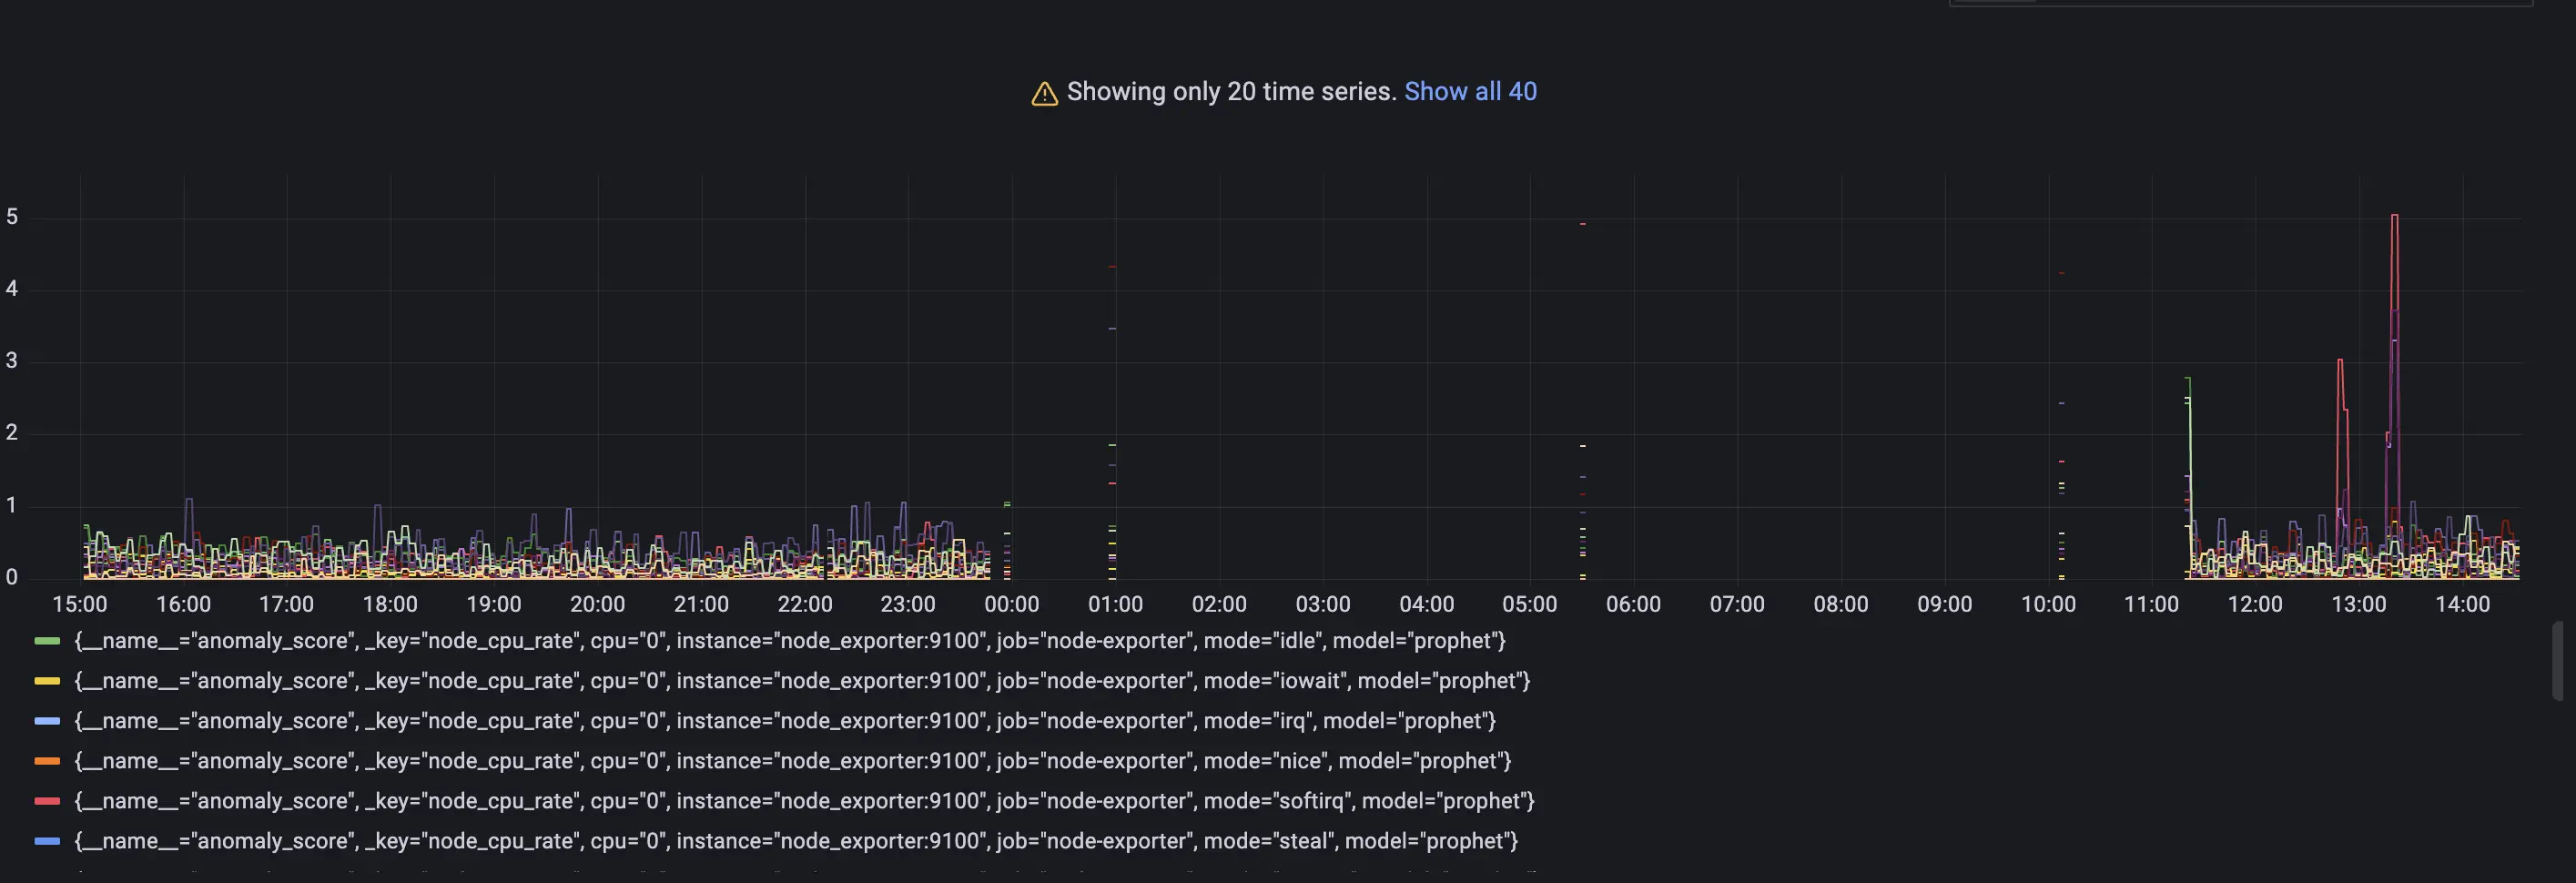
Check out if the anomaly score is high for datapoints you think are anomalies. If not, you can try other parameters in the config file or try other model type. As you may notice a lot of data shows anomaly score greater than 1. It is expected as we just started to scrape and store data and there are not enough datapoints to train on. Just wait for some more time for gathering more data to see how well this particular model can find anomalies. In our configs we put 2 days of data required. ### Actual value from input query with predicted `yhat` metric. Query: `yhat`
 Here we are using one particular set of metrics for visualization. Check out the difference between model prediction and actual values. If values are very different from prediction, it can be considered as anomalous.
### Lower and upper boundaries that model predicted.
Queries: `yhat_lower` and `yhat_upper`
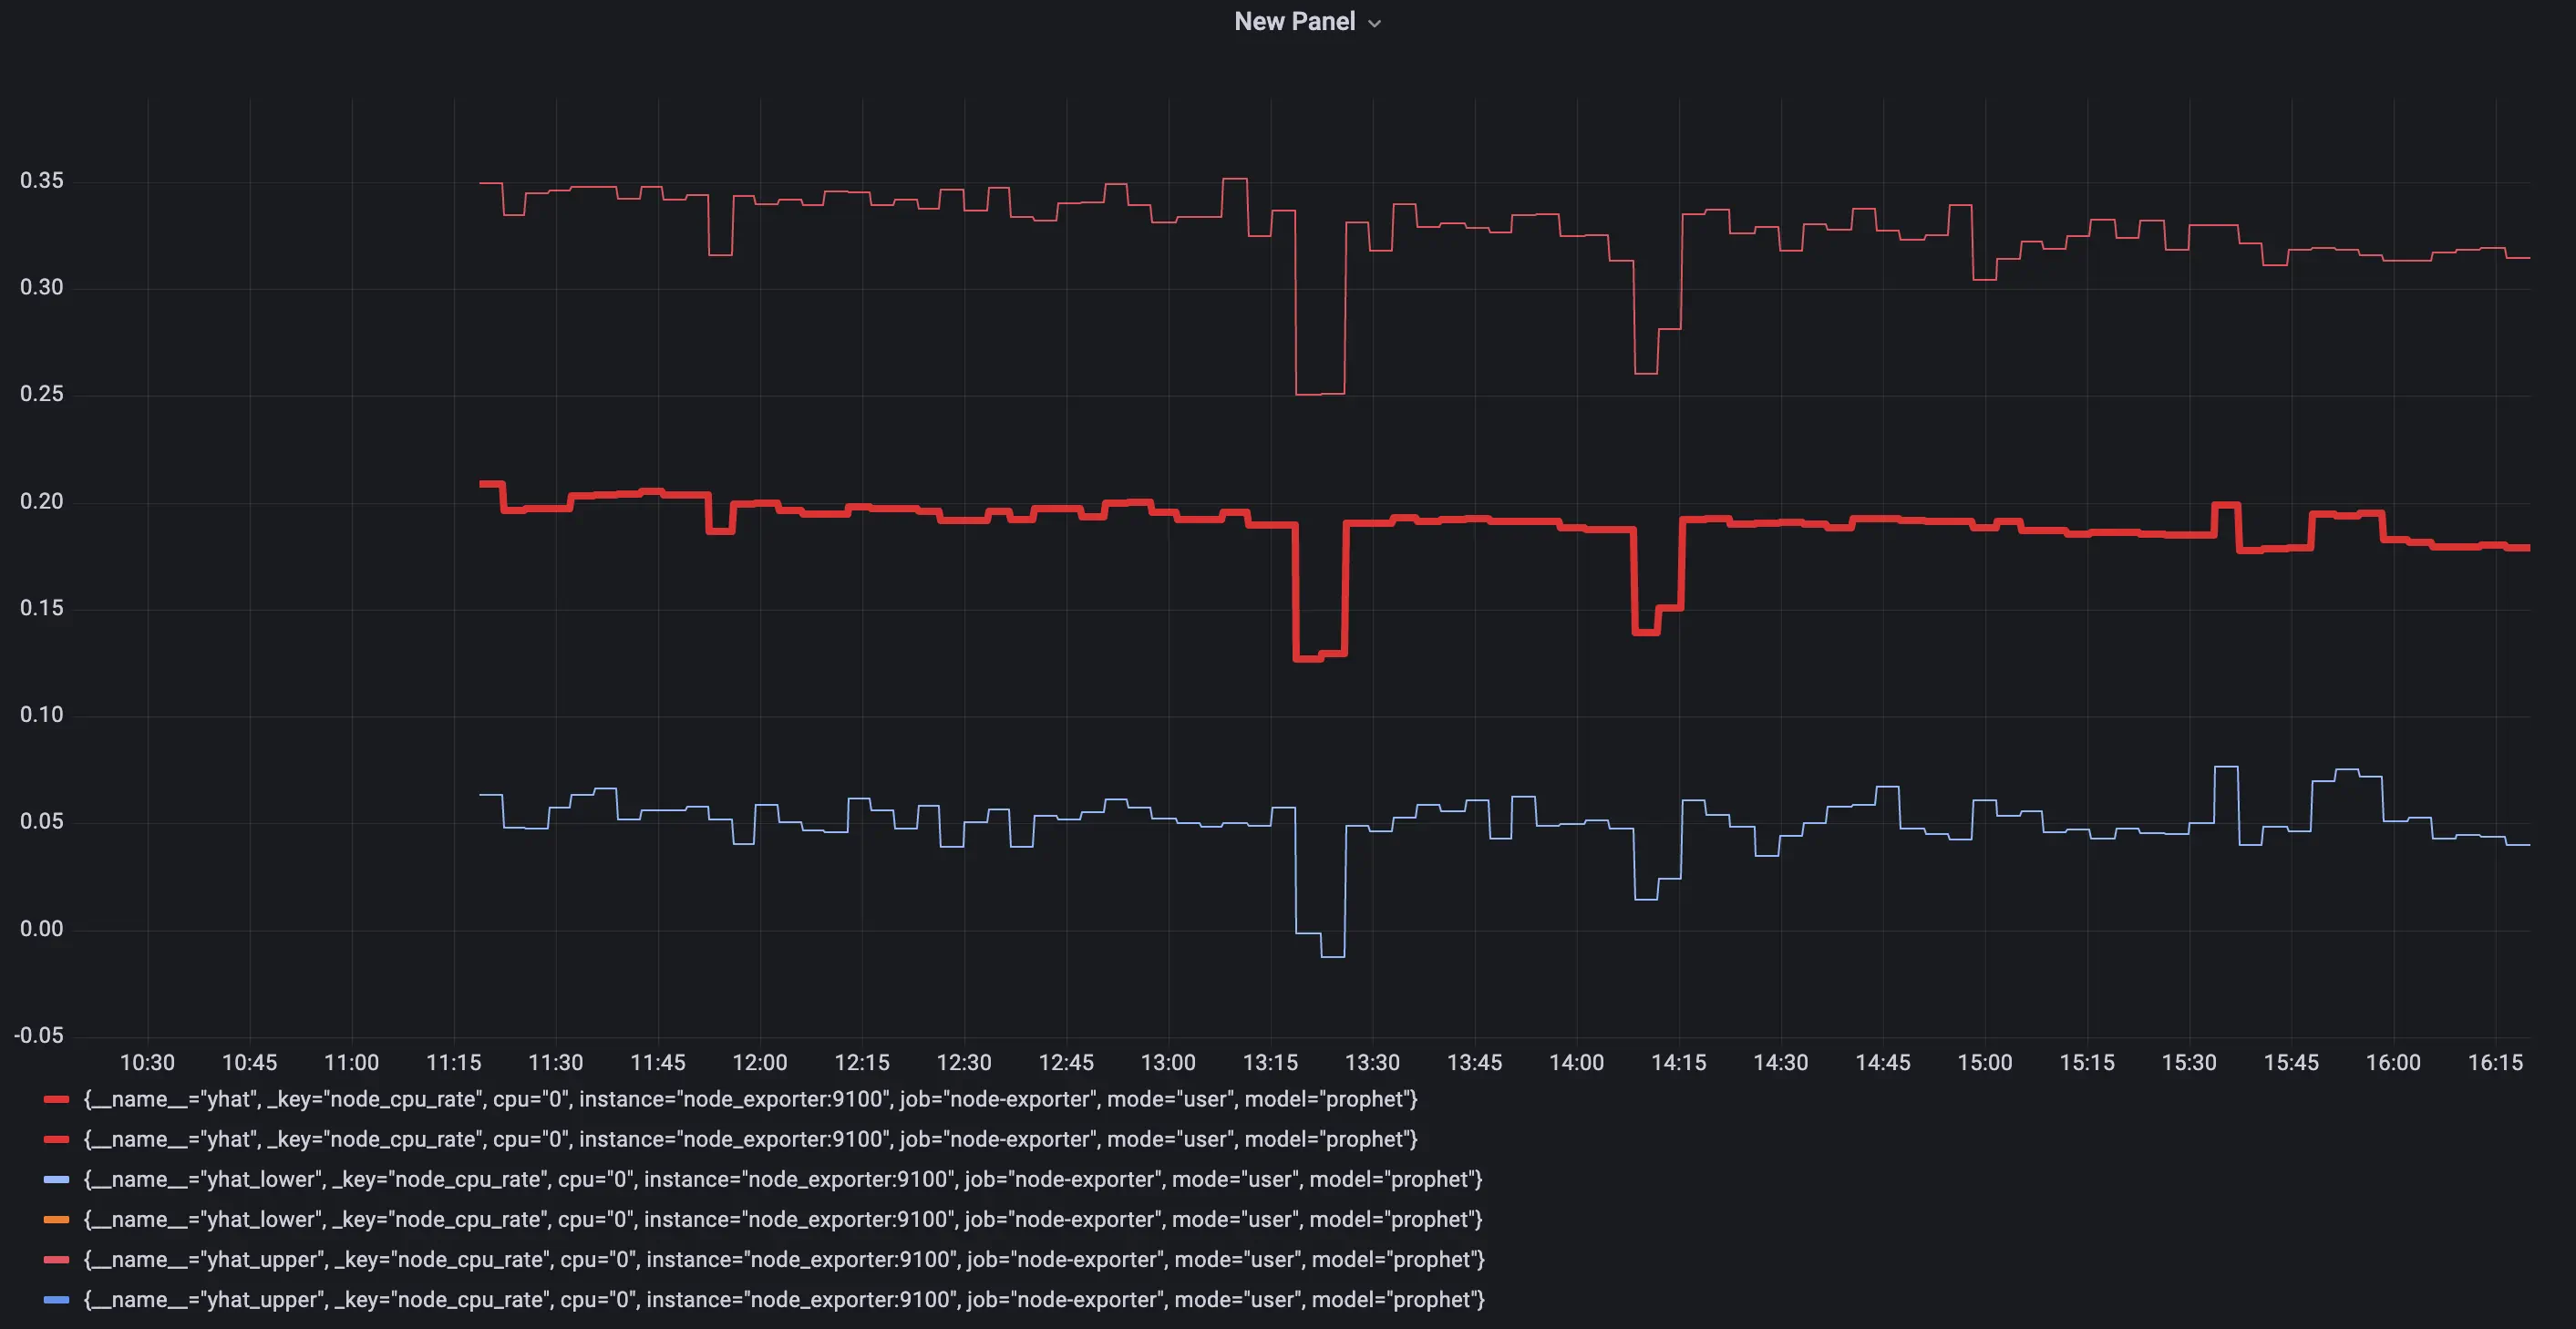 Boundaries of 'normal' metric values according to model inference.
### Alerting
On the page `http://localhost:8880/vmalert/groups` you can find our configured Alerting rule:
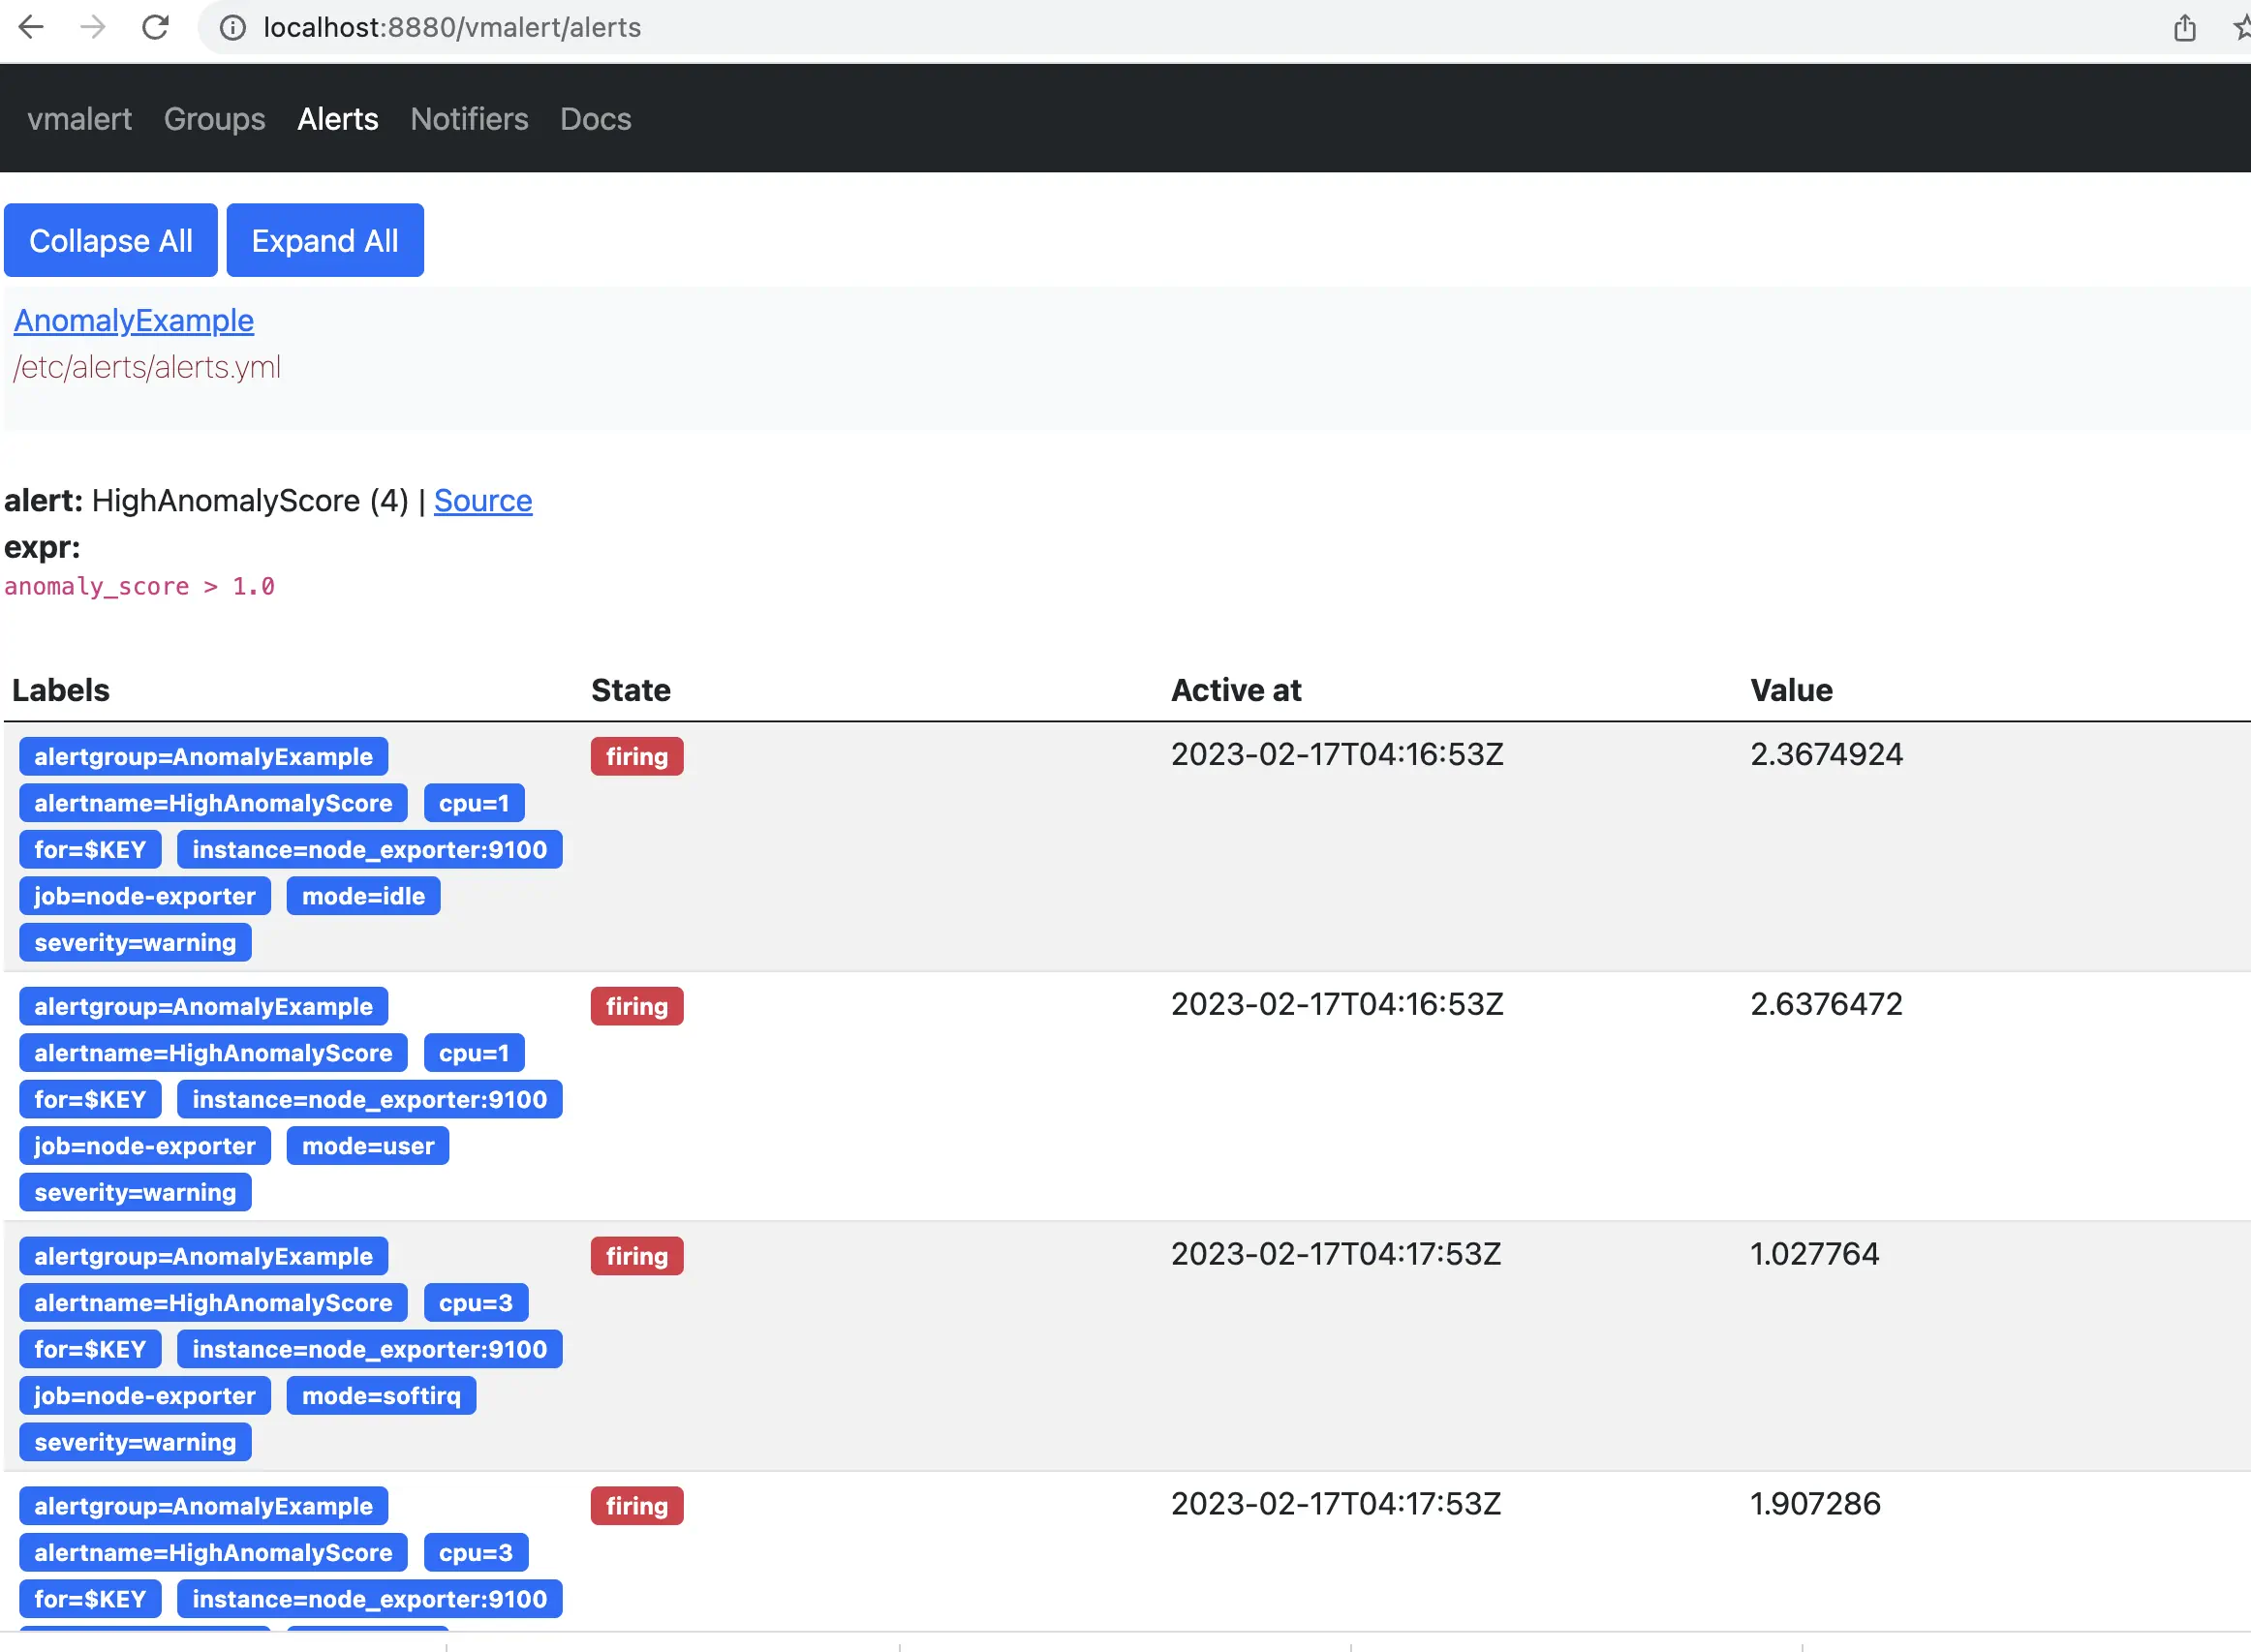
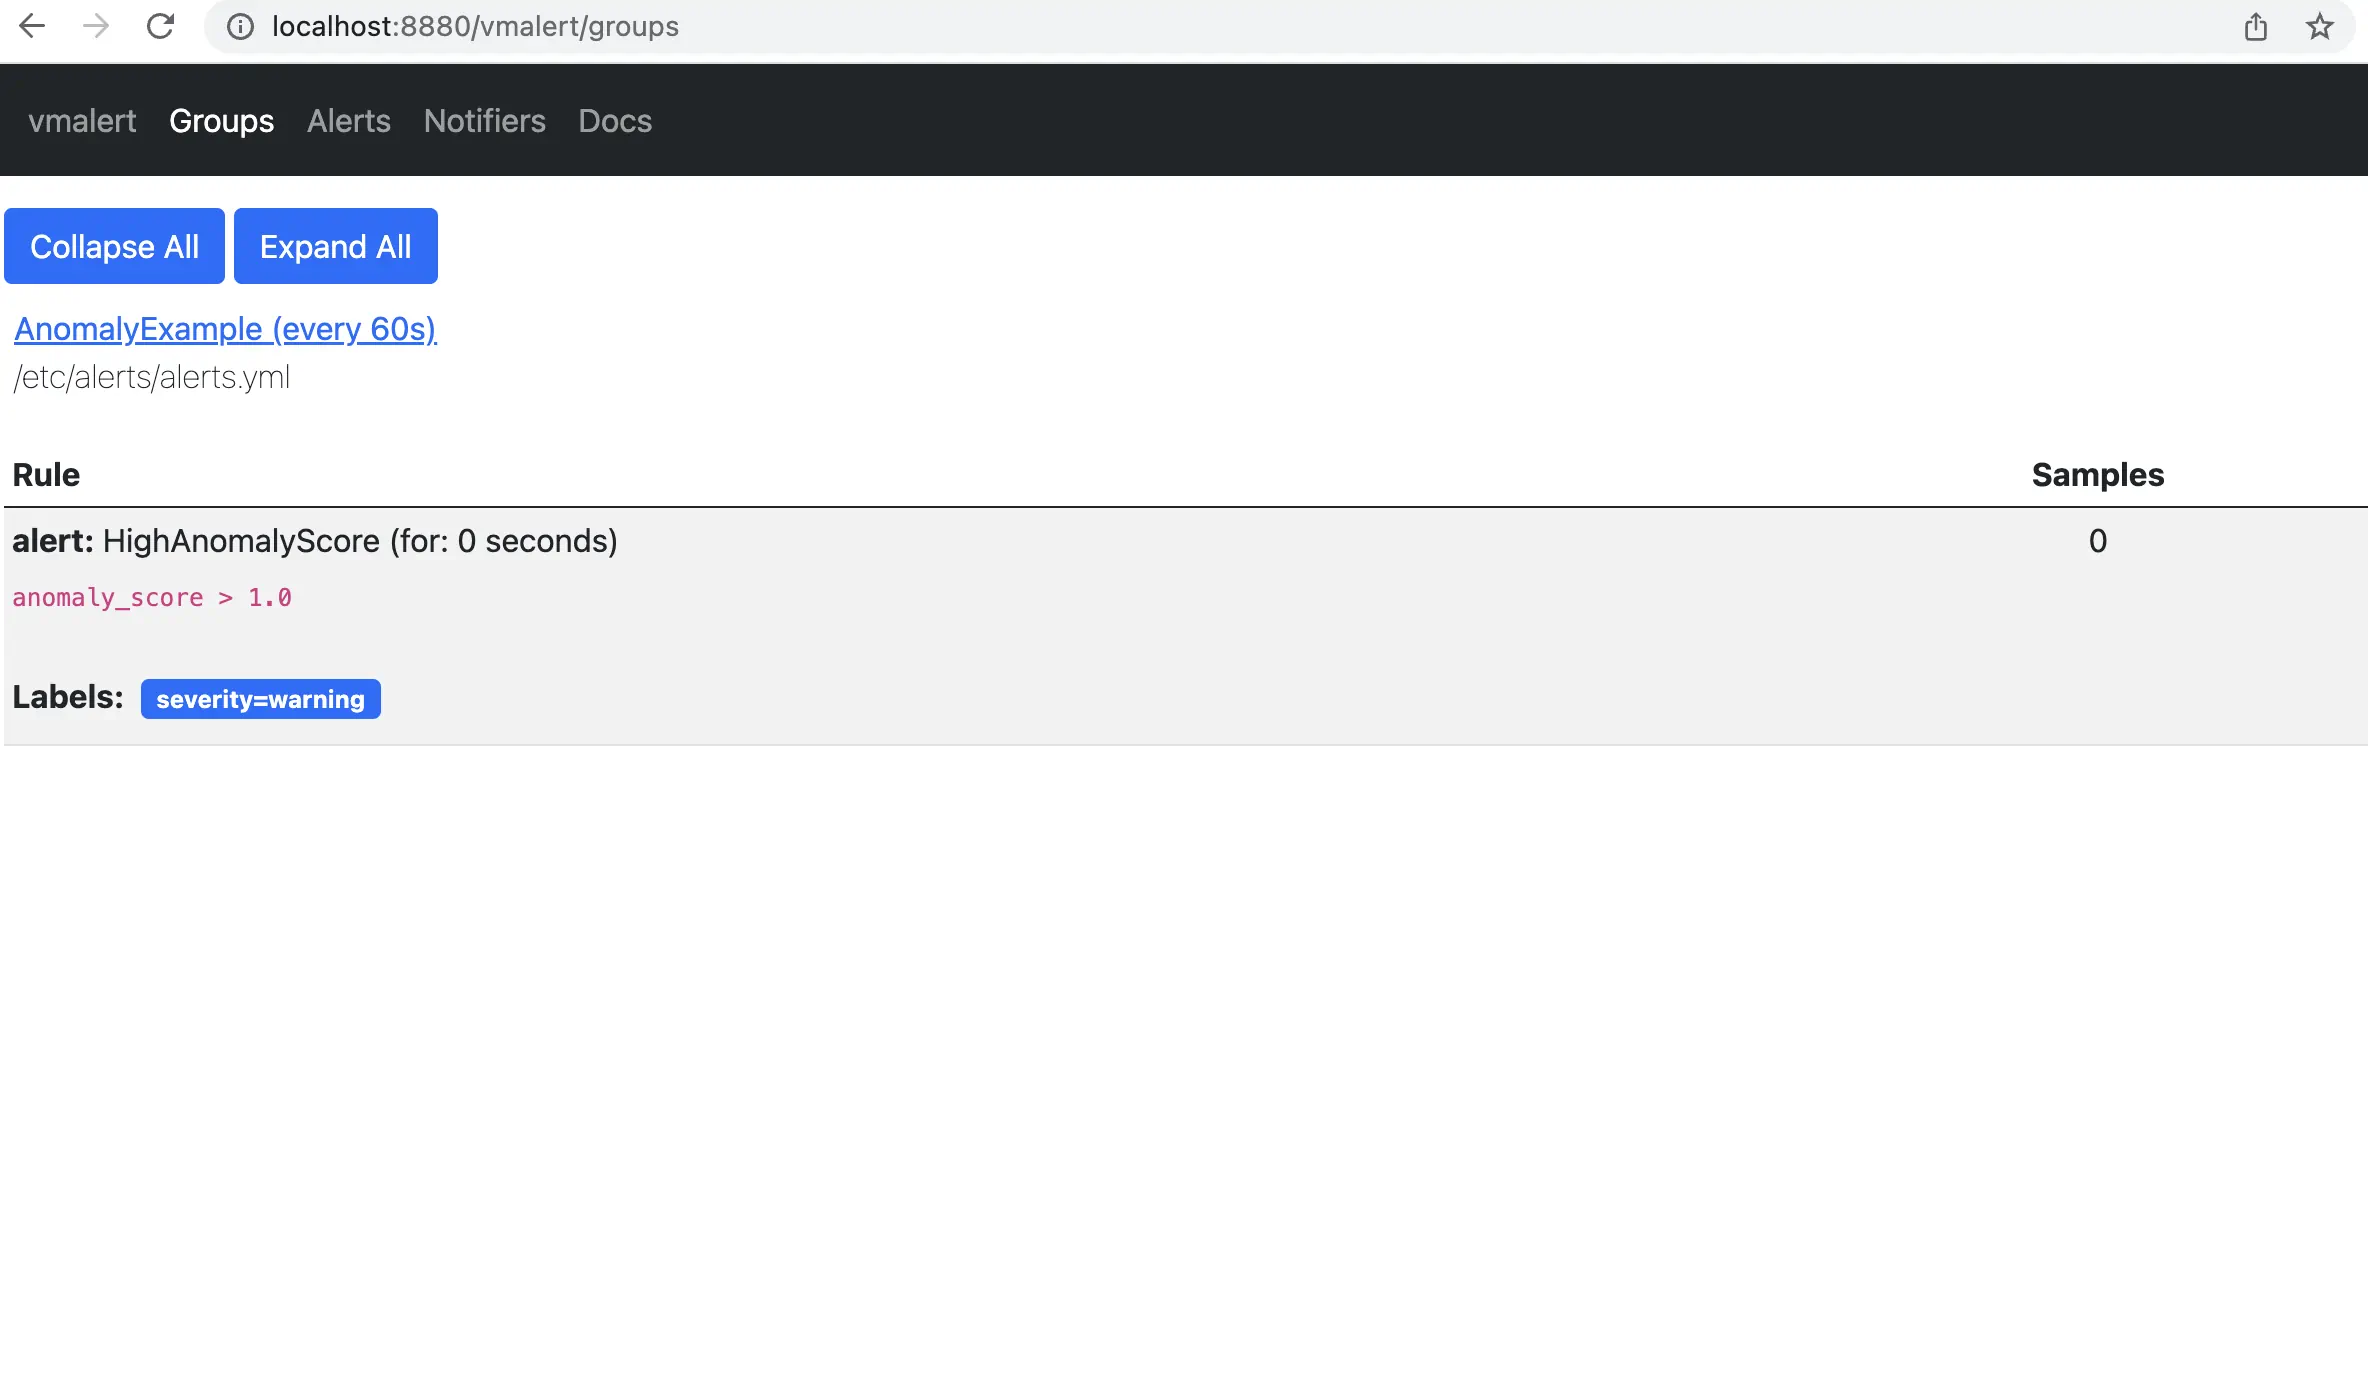 According to the rule configured for vmalert we will see Alert when anomaly score exceed 1. You will see an alert on Alert tab. `http://localhost:8880/vmalert/alerts`
 ## 10. Conclusion
Now we know how to set up Victoria Metric Anomaly Detection tool and use it together with vmalert. We also discovered core vmanomaly generated metrics and behaviour.
 This query result will generate 8 time series per each cpu, and we will use them as an input for our VM Anomaly Detection. vmanomaly will start learning configured model type separately for each of the time series.
## 5. vmanomaly configuration and parameter description
**Parameter description**:
There are 4 required sections in config file:
`scheduler` - defines how often to run and make inferences, as well as what timerange to use to train the model.
`model` - specific model parameters and configurations,
`reader` - how to read data and where it is located
`writer` - where and how to write the generated output.
Let's look into parameters in each section:
* `scheduler`
* `infer_every` - how often trained models will make inferences on new data. Basically, how often to generate new datapoints for anomaly_score. Format examples: 30s, 4m, 2h, 1d. Time granularity ('s' - seconds, 'm' - minutes, 'h' - hours, 'd' - days). You can look at this as how often a model will write its conclusions on newly added data. Here in example we are asking every 1 minute: based on the previous data, do these new datapoints look abnormal?
* `fit_every` - how often to retrain the models. The higher the frequency -- the fresher the model, but the more CPU it consumes. If omitted, the models will be retrained on each infer_every cycle. Format examples: 30s, 4m, 2h, 1d. Time granularity ('s' - seconds, 'm' - minutes, 'h' - hours, 'd' - days).
* `fit_window` - what data interval to use for model training. Longer intervals capture longer historical behavior and detect seasonalities better, but is slower to adapt to permanent changes to metrics behavior. Recommended value is at least two full seasons. Format examples: 30s, 4m, 2h, 1d. Time granularity ('s' - seconds, 'm' - minutes, 'h' - hours, 'd' - days). Here is the previous 14 days of data to put into the model training.
* `model`
* `class` - what model to run. You can use your own model or choose from built-in models: Seasonal Trend Decomposition, Facebook Prophet, ZScore, Rolling Quantile, Holt-Winters, Isolation Forest and ARIMA. Here we use Facebook Prophet (`model.prophet.ProphetModel`).
* `args` - Model specific parameters, represented as YAML dictionary in a simple `key: value` form. For example, you can use parameters that are available in [FB Prophet](https://facebook.github.io/prophet/docs/quick_start.html).
* `reader`
* `datasource_url` - Data source. An HTTP endpoint that serves `/api/v1/query_range`.
* `queries`: - MetricsQL (extension of PromQL) expressions, where you want to find anomalies.
You can put several queries in a form:
`