|
Some checks are pending
publish-docs / Build (push) Waiting to run
### Describe Your Changes doc updates for vmanomaly v1.18.1 ### Checklist The following checks are **mandatory**: - [x] My change adheres [VictoriaMetrics contributing guidelines](https://docs.victoriametrics.com/contributing/). |
||
|---|---|---|
| .. | ||
| _index.md | ||
| autotune.webp | ||
| model-lifecycle-multivariate.webp | ||
| model-lifecycle-univariate.webp | ||
| model-type-non-rolling.webp | ||
| model-type-rolling.webp | ||
| models.md | ||
| monitoring.md | ||
| reader.md | ||
| README.md | ||
| scheduler.md | ||
| schema_detection_direction=above_expected.webp | ||
| schema_detection_direction=below_expected.webp | ||
| schema_detection_direction=both.webp | ||
| schema_min_dev_from_expected=0.webp | ||
| schema_min_dev_from_expected=1.0.webp | ||
| schema_min_dev_from_expected=5.0.webp | ||
| vmanomaly-components.webp | ||
| writer.md | ||
This chapter describes different components, that correspond to respective sections of a config to launch VictoriaMetrics Anomaly Detection (or simply vmanomaly) service:
- Model(s) section - Required
- Reader section - Required
- Scheduler(s) section - Required
- Writer section - Required
- Monitoring section - Optional
Note
: starting from v1.7.0, once the service starts, automated config validation is performed. Please see container logs for errors that need to be fixed to create fully valid config, visiting sections above for examples and documentation.
Note
: starting from v1.13.0, components' class can be referenced by a short alias instead of a full class path - i.e.
model.zscore.ZscoreModelbecomeszscore,reader.vm.VmReaderbecomesvm,scheduler.periodic.PeriodicSchedulerbecomesperiodic, etc. Please see according sections for the details.
Note: Starting from v1.13.0
presetmodes are available forvmanomaly. Please find the guide here.
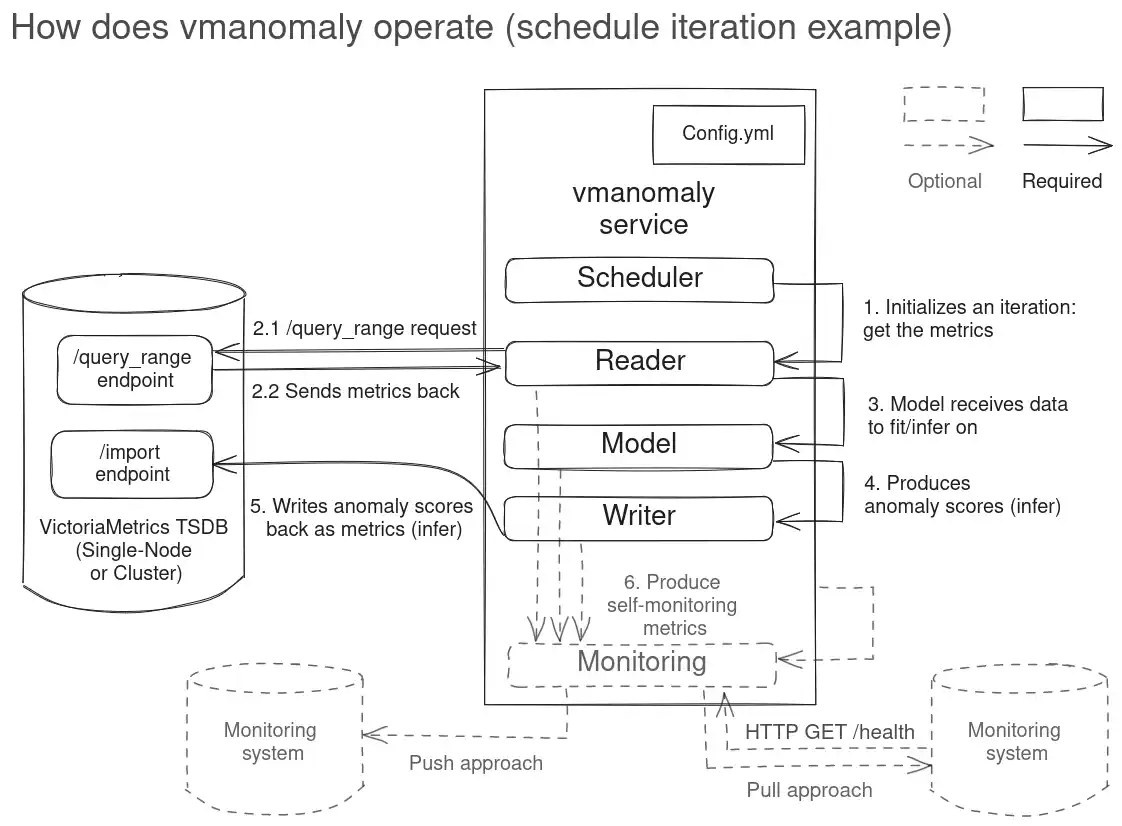
Below, you will find an example illustrating how the components of vmanomaly interact with each other and with a single-node VictoriaMetrics setup.
Note
: Reader and Writer also support multitenancy, so you can read/write from/to different locations - see
tenant_idparam description.
Here's a minimalistic full config example, demonstrating many-to-many configuration (actual for latest version):
# how and when to run the models is defined by schedulers
# https://docs.victoriametrics.com/anomaly-detection/components/scheduler/
schedulers:
  periodic_1d:  # alias
    class: 'periodic' # scheduler class
    infer_every: "30s"
    fit_every: "10m"
    fit_window: "24h"
  periodic_1w:
    class: 'periodic'
    infer_every: "15m"
    fit_every: "1h"
    fit_window: "7d"

# what model types and with what hyperparams to run on your data
# https://docs.victoriametrics.com/anomaly-detection/components/models/
models:
  zscore:  # we can set up alias for model
    class: 'zscore'  # model class
    z_threshold: 3.5
    provide_series: ['anomaly_score']  # what series to produce
    queries: ['host_network_receive_errors']  # what queries to run particular model on
    schedulers: ['periodic_1d']  # will be attached to 1-day schedule, fit every 10m and infer every 30s
    min_dev_from_expected: 0.0  # turned off. if |y - yhat| < min_dev_from_expected, anomaly score will be 0
    detection_direction: 'above_expected' # detect anomalies only when y > yhat, "peaks"
  prophet: # we can set up alias for model
    class: 'prophet'
    provide_series: ['anomaly_score', 'yhat', 'yhat_lower', 'yhat_upper']
    queries: ['cpu_seconds_total']
    schedulers: ['periodic_1w']  # will be attached to 1-week schedule, fit every 1h and infer every 15m
    min_dev_from_expected: 0.01  # if |y - yhat| < 0.01, anomaly score will be 0
    detection_direction: 'above_expected'
    args:  # model-specific arguments
      interval_width: 0.98

# where to read data from
# https://docs.victoriametrics.com/anomaly-detection/components/reader/#vm-reader
reader:
  datasource_url: "https://play.victoriametrics.com/"
  tenant_id: "0:0"
  class: 'vm'
  sampling_period: "30s"  # what data resolution to fetch from VictoriaMetrics' /query_range endpoint
  latency_offset: '1ms'
  query_from_last_seen_timestamp: False
  queries:  # aliases to MetricsQL expressions
    cpu_seconds_total:
      expr: 'avg(rate(node_cpu_seconds_total[5m])) by (mode)'
      # step: '30s'  # if not set, will be equal to sampling_period
      data_range: [0, 'inf']  # expected value range, anomaly_score > 1 if y (real value) is outside
    host_network_receive_errors:
      expr: 'rate(node_network_receive_errs_total[3m]) / rate(node_network_receive_packets_total[3m])'
      step: '15m'  # here we override per-query `sampling_period` to request way less data from VM TSDB
      data_range: [0, 'inf']

# where to write data to
# https://docs.victoriametrics.com/anomaly-detection/components/writer/
writer:
  datasource_url: "http://victoriametrics:8428/"

# enable self-monitoring in pull and/or push mode
# https://docs.victoriametrics.com/anomaly-detection/components/monitoring/
monitoring:
  pull: # Enable /metrics endpoint.
    addr: "0.0.0.0"
    port: 8490
