34 KiB
| sort | weight | title | menu | aliases | |||||||
|---|---|---|---|---|---|---|---|---|---|---|---|
| 98 | 98 | Streaming aggregation |
|
|
Streaming aggregation
vmagent and single-node VictoriaMetrics can aggregate incoming samples in streaming mode by time and by labels before data is written to remote storage. The aggregation is applied to all the metrics received via any supported data ingestion protocol and/or scraped from Prometheus-compatible targets.
Stream aggregation ignores timestamps associated with the input samples. It expects that the ingested samples have timestamps close to the current time.
Stream aggregation is configured via the following command-line flags:
-remoteWrite.streamAggr.configat vmagent. This flag can be specified individually per each-remoteWrite.url. This allows writing different aggregates to different remote storage destinations.-streamAggr.configat single-node VictoriaMetrics.
These flags must point to a file containing stream aggregation config.
By default, the following data is written to the storage when stream aggregation is enabled:
- the aggregated samples;
- the raw input samples, which didn't match any
matchoption in the provided config.
This behaviour can be changed via the following command-line flags:
-remoteWrite.streamAggr.keepInputat vmagent and-streamAggr.keepInputat single-node VictoriaMetrics. If one of these flags are set, then all the input samples are written to the storage alongside the aggregated samples. The-remoteWrite.streamAggr.keepInputflag can be specified individually per each-remoteWrite.url.-remoteWrite.streamAggr.dropInputat vmagent and-streamAggr.dropInputat single-node VictoriaMetrics. If one of these flags are set, then all the input samples are dropped, while only the aggregated samples are written to the storage. The-remoteWrite.streamAggr.dropInputflag can be specified individually per each-remoteWrite.url.
By default, all the input samples are aggregated. Sometimes it is needed to de-duplicate samples before the aggregation. For example, if the samples are received from replicated sources. The following command-line flag can be used for enabling the de-duplication before aggregation in this case:
-remoteWrite.streamAggr.dedupIntervalat vmagent. This flag can be specified individually per each-remoteWrite.url. This allows setting different de-duplication intervals per each configured remote storage.-streamAggr.dedupIntervalat single-node VictoriaMetrics.
Use cases
Stream aggregation can be used in the following cases:
- Statsd alternative
- Recording rules alternative
- Reducing the number of stored samples
- Reducing the number of stored series
Statsd alternative
Stream aggregation can be used as statsd alternative in the following cases:
- Counting input samples
- Summing input metrics
- Quantiles over input metrics
- Histograms over input metrics
- Aggregating histograms
Currently, streaming aggregation is available only for supported data ingestion protocols and not available for Statsd metrics format.
Recording rules alternative
Sometimes alerting queries may require non-trivial amounts of CPU, RAM,
disk IO and network bandwidth at metrics storage side. For example, if http_request_duration_seconds histogram is generated by thousands
of application instances, then the alerting query histogram_quantile(0.99, sum(increase(http_request_duration_seconds_bucket[5m])) without (instance)) > 0.5
can become slow, since it needs to scan too big number of unique time series
with http_request_duration_seconds_bucket name. This alerting query can be speed up by pre-calculating
the sum(increase(http_request_duration_seconds_bucket[5m])) without (instance) via recording rule.
But this recording rule may take too much time to execute too. In this case the slow recording rule can be substituted
with the following stream aggregation config:
- match: 'http_request_duration_seconds_bucket'
  interval: 5m
  without: [instance]
  outputs: [total]
This stream aggregation generates http_request_duration_seconds_bucket:5m_without_instance_total output series according to output metric naming.
Then these series can be used in alerting rules:
histogram_quantile(0.99, last_over_time(http_request_duration_seconds_bucket:5m_without_instance_total[5m])) > 0.5
This query is executed much faster than the original query, because it needs to scan much lower number of time series.
See the list of aggregate output, which can be specified at output field.
See also aggregating by labels.
Field interval is recommended to be set to a value at least several times higher than your metrics collect interval.
Reducing the number of stored samples
If per-series samples are ingested at high frequency, then this may result in high disk space usage, since too much data must be stored to disk. This also may result in slow queries, since too much data must be processed during queries.
This can be fixed with the stream aggregation by increasing the interval between per-series samples stored in the database.
For example, the following stream aggregation config reduces the frequency of input samples to one sample per 5 minutes per each input time series (this operation is also known as downsampling):
  # Aggregate metrics ending with _total with `total` output.
  # See https://docs.victoriametrics.com/stream-aggregation.html#aggregation-outputs
- match: '{__name__=~".+_total"}'
  interval: 5m
  outputs: [total]

  # Downsample other metrics with `count_samples`, `sum_samples`, `min` and `max` outputs
  # See https://docs.victoriametrics.com/stream-aggregation.html#aggregation-outputs
- match: '{__name__!~".+_total"}'
  interval: 5m
  outputs: [count_samples, sum_samples, min, max]
The aggregated output metrics have the following names according to output metric naming:
# For input metrics ending with _total
some_metric_total:5m_total

# For input metrics not ending with _total
some_metric:5m_count_samples
some_metric:5m_sum_samples
some_metric:5m_min
some_metric:5m_max
See the list of aggregate output, which can be specified at output field.
See also aggregating histograms and aggregating by labels.
Reducing the number of stored series
Sometimes applications may generate too many time series.
For example, the http_requests_total metric may have path or user label with too big number of unique values.
In this case the following stream aggregation can be used for reducing the number metrics stored in VictoriaMetrics:
- match: 'http_requests_total'
  interval: 30s
  without: [path, user]
  outputs: [total]
This config specifies labels, which must be removed from the aggregate output, in the without list.
See these docs for more details.
The aggregated output metric has the following name according to output metric naming:
http_requests_total:30s_without_path_user_total
See the list of aggregate output, which can be specified at output field.
See also aggregating histograms.
Counting input samples
If the monitored application generates event-based metrics, then it may be useful to count the number of such metrics at stream aggregation level.
For example, if an advertising server generates hits{some="labels"} 1 and clicks{some="labels"} 1 metrics
per each incoming hit and click, then the following stream aggregation config
can be used for counting these metrics per every 30 second interval:
- match: '{__name__=~"hits|clicks"}'
  interval: 30s
  outputs: [count_samples]
This config generates the following output metrics for hits and clicks input metrics
according to output metric naming:
hits:30s_count_samples count1
clicks:30s_count_samples count2
See the list of aggregate output, which can be specified at output field.
See also aggregating by labels.
Summing input metrics
If the monitored application calculates some events and then sends the calculated number of events to VictoriaMetrics at irregular intervals or at too high frequency, then stream aggregation can be used for summing such events and writing the aggregate sums to the storage at regular intervals.
For example, if an advertising server generates hits{some="labels} N and clicks{some="labels"} M metrics
at irregular intervals, then the following stream aggregation config
can be used for summing these metrics per every minute:
- match: '{__name__=~"hits|clicks"}'
  interval: 1m
  outputs: [sum_samples]
This config generates the following output metrics according to output metric naming:
hits:1m_sum_samples sum1
clicks:1m_sum_samples sum2
See the list of aggregate output, which can be specified at output field.
See also aggregating by labels.
Quantiles over input metrics
If the monitored application generates measurement metrics per each request, then it may be useful to calculate the pre-defined set of percentiles over these measurements.
For example, if the monitored application generates request_duration_seconds N and response_size_bytes M metrics
per each incoming request, then the following stream aggregation config
can be used for calculating 50th and 99th percentiles for these metrics every 30 seconds:
- match:
  - request_duration_seconds
  - response_size_bytes
  interval: 30s
  outputs: ["quantiles(0.50, 0.99)"]
This config generates the following output metrics according to output metric naming:
request_duration_seconds:30s_quantiles{quantile="0.50"} value1
request_duration_seconds:30s_quantiles{quantile="0.99"} value2

response_size_bytes:30s_quantiles{quantile="0.50"} value1
response_size_bytes:30s_quantiles{quantile="0.99"} value2
See the list of aggregate output, which can be specified at output field.
See also histograms over input metrics and aggregating by labels.
Histograms over input metrics
If the monitored application generates measurement metrics per each request, then it may be useful to calculate a histogram over these metrics.
For example, if the monitored application generates request_duration_seconds N and response_size_bytes M metrics
per each incoming request, then the following stream aggregation config
can be used for calculating VictoriaMetrics histogram buckets
for these metrics every 60 seconds:
- match:
  - request_duration_seconds
  - response_size_bytes
  interval: 60s
  outputs: [histogram_bucket]
This config generates the following output metrics according to output metric naming.
request_duration_seconds:60s_histogram_bucket{vmrange="start1...end1"} count1
request_duration_seconds:60s_histogram_bucket{vmrange="start2...end2"} count2
...
request_duration_seconds:60s_histogram_bucket{vmrange="startN...endN"} countN

response_size_bytes:60s_histogram_bucket{vmrange="start1...end1"} count1
response_size_bytes:60s_histogram_bucket{vmrange="start2...end2"} count2
...
response_size_bytes:60s_histogram_bucket{vmrange="startN...endN"} countN
The resulting histogram buckets can be queried with MetricsQL in the following ways:
-
An estimated 50th and 99th percentiles of the request duration over the last hour:
histogram_quantiles("quantile", 0.50, 0.99, sum(increase(request_duration_seconds:60s_histogram_bucket[1h])) by (vmrange))This query uses histogram_quantiles function.
-
An estimated standard deviation of the request duration over the last hour:
histogram_stddev(sum(increase(request_duration_seconds:60s_histogram_bucket[1h])) by (vmrange))This query uses histogram_stddev function.
-
An estimated share of requests with the duration smaller than
0.5sover the last hour:histogram_share(0.5, sum(increase(request_duration_seconds:60s_histogram_bucket[1h])) by (vmrange))This query uses histogram_share function.
See the list of aggregate output, which can be specified at output field.
See also quantiles over input metrics and aggregating by labels.
Aggregating histograms
Histogram is a set of counter
metrics with different vmrange or le labels. As they're counters, the applicable aggregation output is
total:
- match: 'http_request_duration_seconds_bucket'
  interval: 1m
  without: [instance]
  outputs: [total]
  output_relabel_configs:
    - source_labels: [__name__]
      target_label: __name__
This config generates the following output metrics according to output metric naming:
http_request_duration_seconds_bucket:1m_without_instance_total{le="0.1"} value1
http_request_duration_seconds_bucket:1m_without_instance_total{le="0.2"} value2
http_request_duration_seconds_bucket:1m_without_instance_total{le="0.4"} value3
http_request_duration_seconds_bucket:1m_without_instance_total{le="1"}   value4
http_request_duration_seconds_bucket:1m_without_instance_total{le="3"}   value5
http_request_duration_seconds_bucket:1m_without_instance_total{le="8"}   value6
http_request_duration_seconds_bucket:1m_without_instance_total{le="20"}  value7
http_request_duration_seconds_bucket:1m_without_instance_total{le="60"}  value8
http_request_duration_seconds_bucket:1m_without_instance_total{le="120"} value9
http_request_duration_seconds_bucket:1m_without_instance_total{le="+Inf" value10
The resulting metrics can be used in histogram_quantile function:
histogram_quantile(0.9, sum(rate(http_request_duration_seconds_bucket:1m_without_instance_total[5m])) by(le))
Please note, histograms can be aggregated if their le labels are configured identically.
VictoriaMetrics histogram buckets
have no such requirement.
See the list of aggregate output, which can be specified at output field.
See also histograms over input metrics and quantiles over input metrics.
Output metric names
Output metric names for stream aggregation are constructed according to the following pattern:
<metric_name>:<interval>[_by_<by_labels>][_without_<without_labels>]_<output>
<metric_name>is the original metric name.<interval>is the interval specified in the stream aggregation config.<by_labels>is_-delimited sorted list ofbylabels specified in the stream aggregation config. If thebylist is missing in the config, then the_by_<by_labels>part isn't included in the output metric name.<without_labels>is an optional_-delimited sorted list ofwithoutlabels specified in the stream aggregation config. If thewithoutlist is missing in the config, then the_without_<without_labels>part isn't included in the output metric name.<output>is the aggregate used for constructing the output metric. The aggregate name is taken from theoutputslist at the corresponding stream aggregation config.
Both input and output metric names can be modified if needed via relabeling according to these docs.
Relabeling
It is possible to apply arbitrary relabeling to input and output metrics
during stream aggregation via input_relabel_configs and output_relabel_config options in stream aggregation config.
For example, the following config removes the :1m_sum_samples suffix added to the output metric name:
- interval: 1m
  outputs: [sum_samples]
  output_relabel_configs:
  - source_labels: [__name__]
    target_label: __name__
    regex: "(.+):.+"
Aggregation outputs
The aggregations are calculated during the interval specified in the config
and then sent to the storage.
If by and without lists are specified in the config,
then the aggregation by labels is performed additionally to aggregation by interval.
Below are aggregation functions that can be put in the outputs list at stream aggregation config.
total
total generates output counter by summing the input counters.
total only makes sense for aggregating counter metrics.
The results of total is equal to the sum(some_counter) query.
For example, see below time series produced by config with aggregation interval 1m and by: ["instance"] and the regular query:
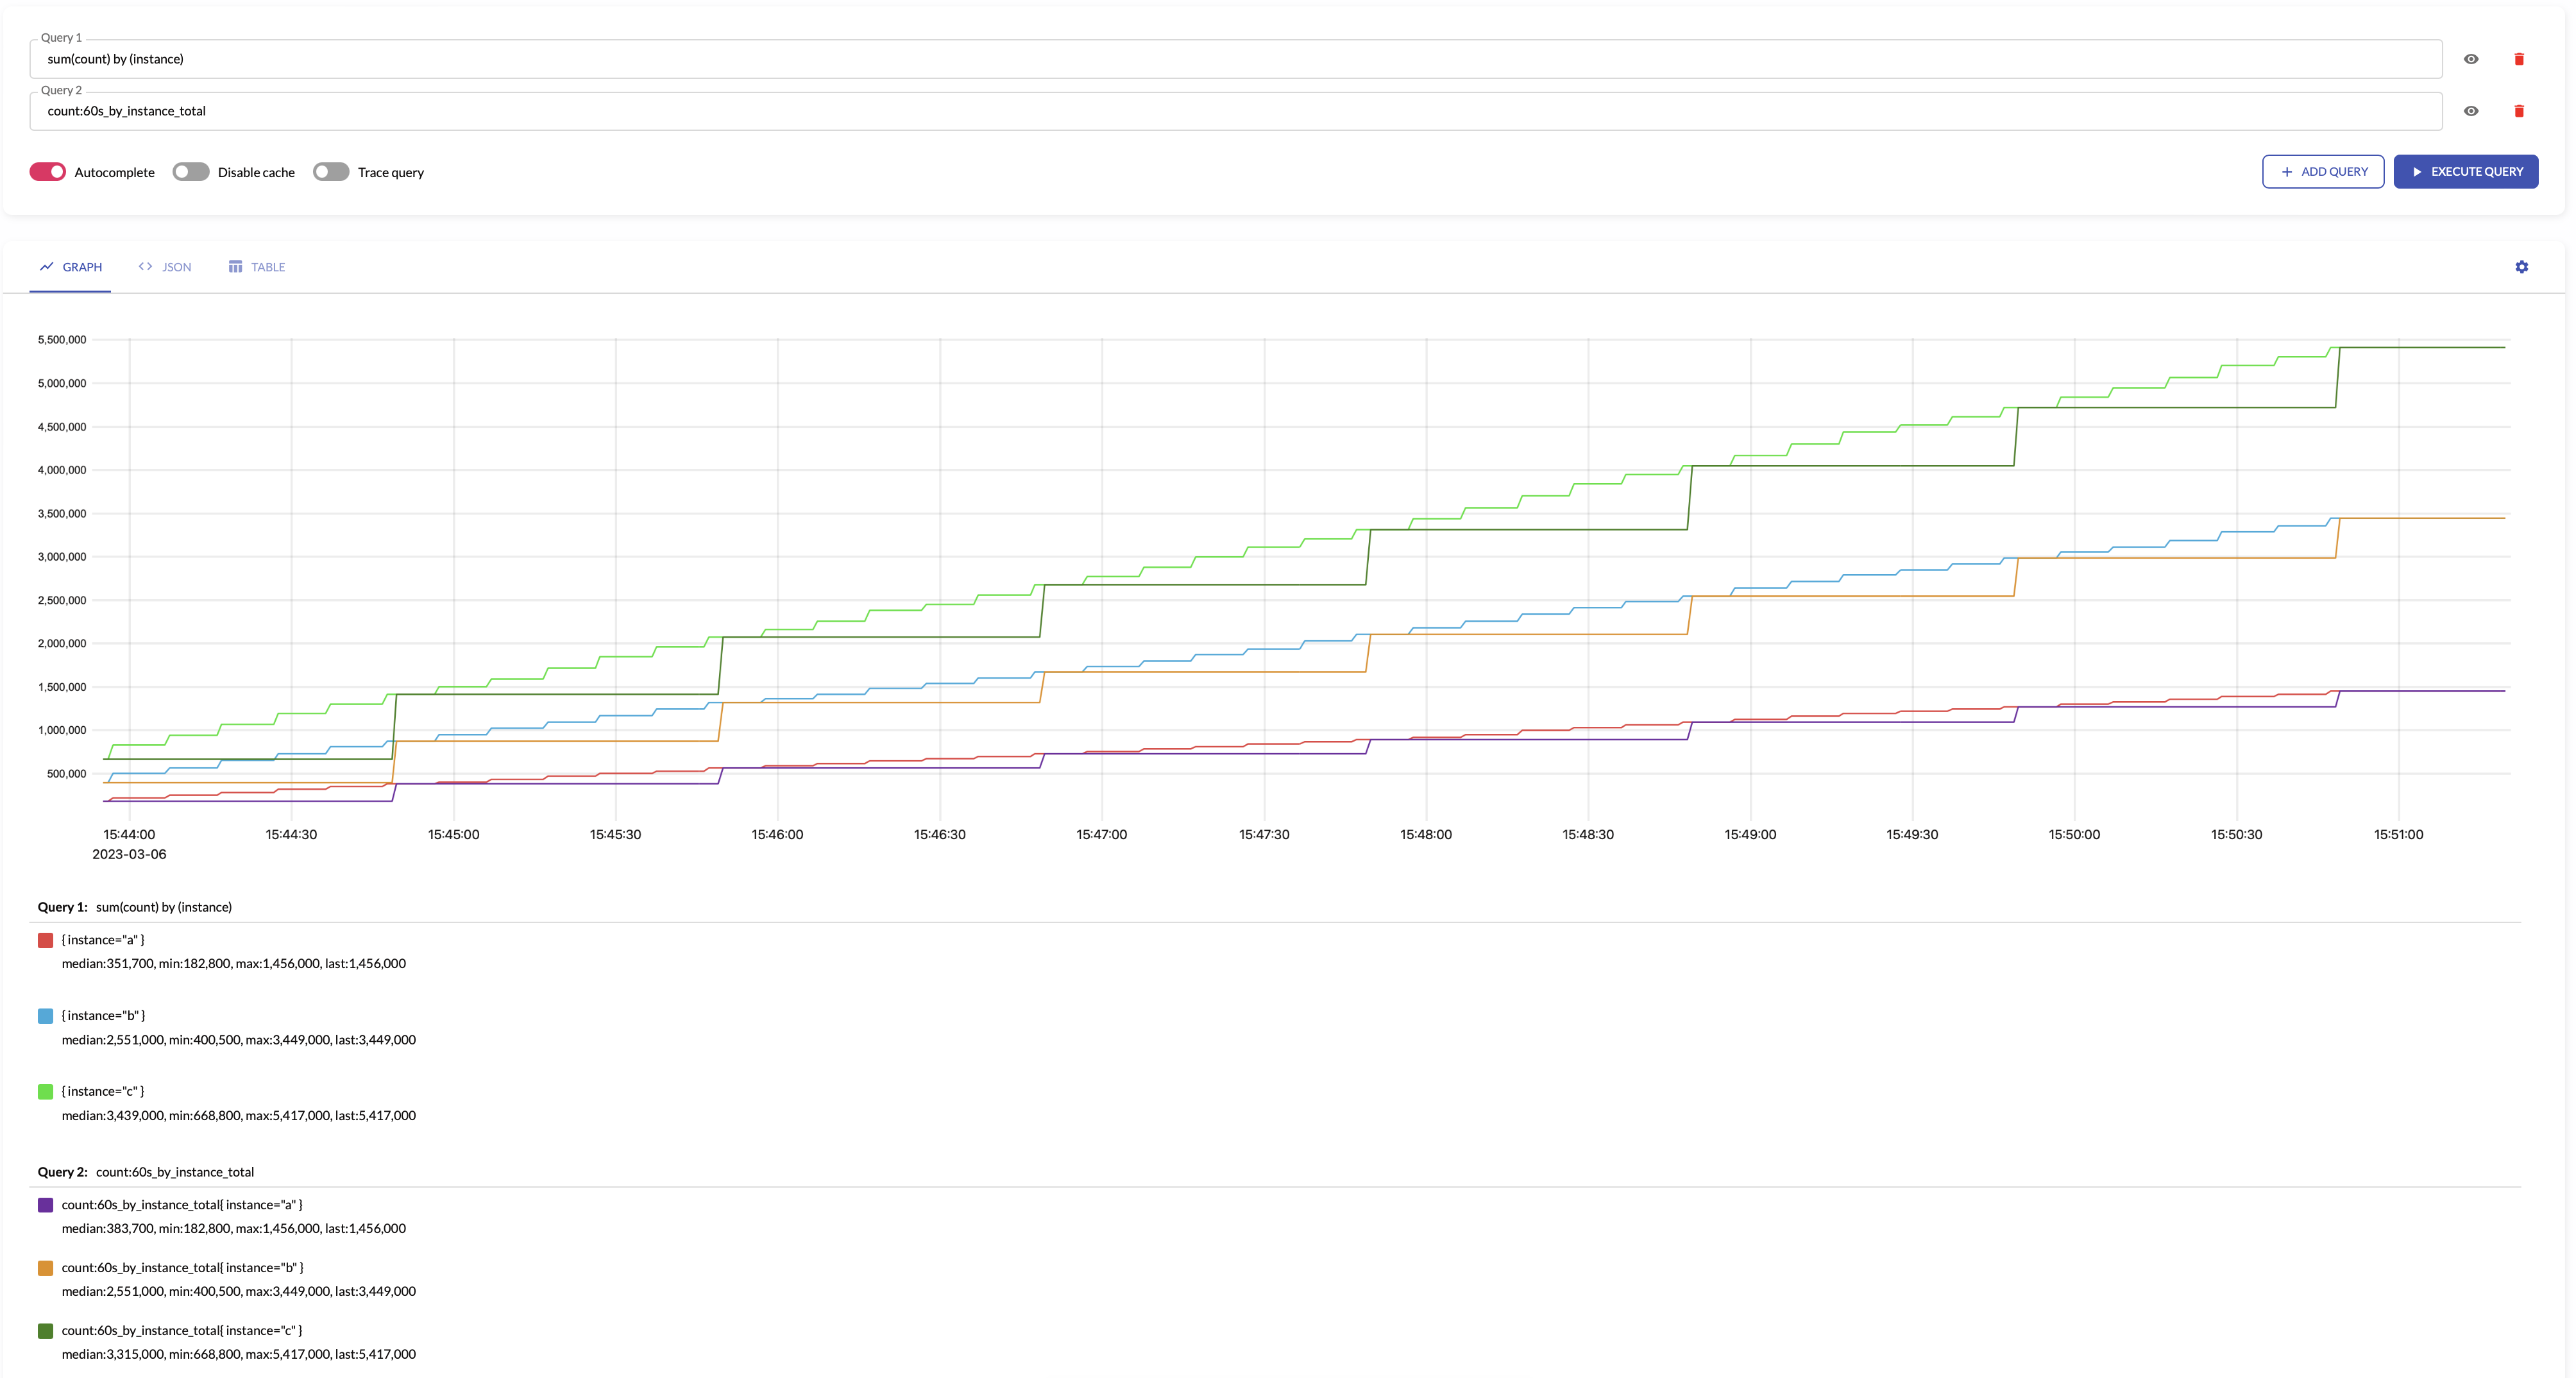
total is not affected by counter resets -
it continues to increase monotonically with respect to the previous value.
The counters are most often reset when the application is restarted.
For example:
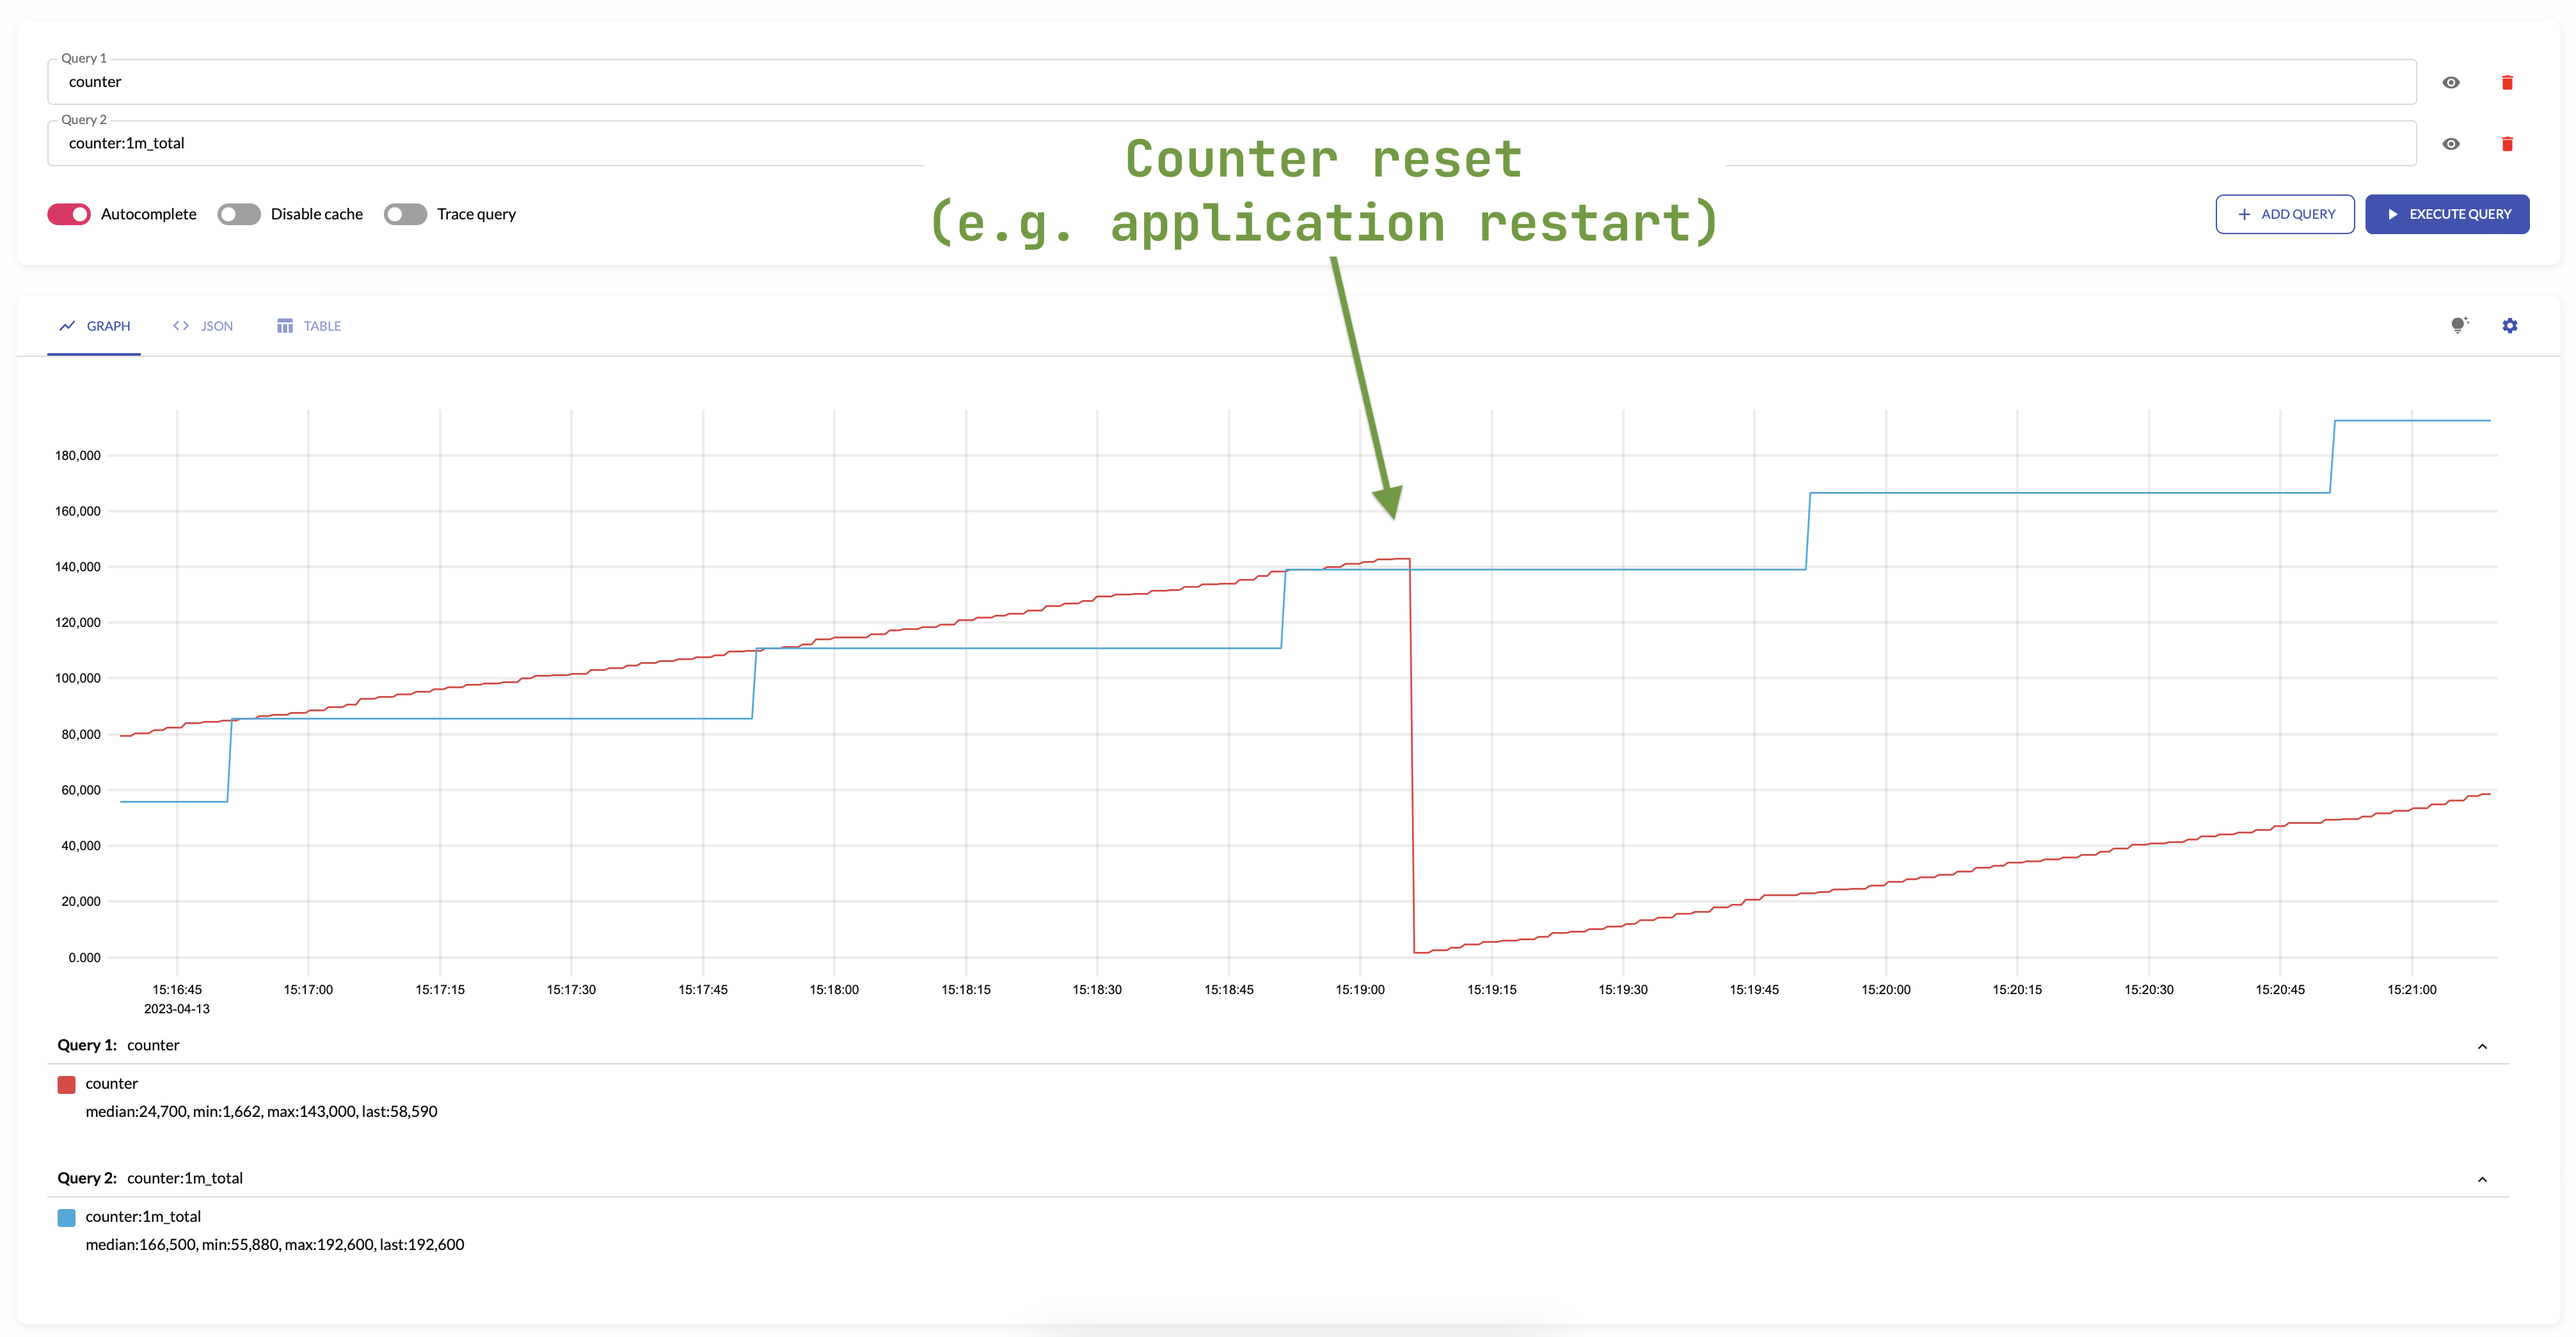
The same behavior will occur when creating or deleting new series in an aggregation group -
total will increase monotonically considering the values of the series set.
An example of changing a set of series can be restarting a pod in the Kubernetes.
This changes a label with pod's name in the series, but total account for such a scenario and do not reset the state of aggregated metric.
Aggregating irregular and sporadic metrics (received from Lambdas or Cloud Functions) can be controlled via staleness_inteval.
increase
increase returns the increase of input counters.
increase only makes sense for aggregating counter metrics.
The results of increase with aggregation interval of 1m is equal to the increase(some_counter[1m]) query.
For example, see below time series produced by config with aggregation interval 1m and by: ["instance"] and the regular query:
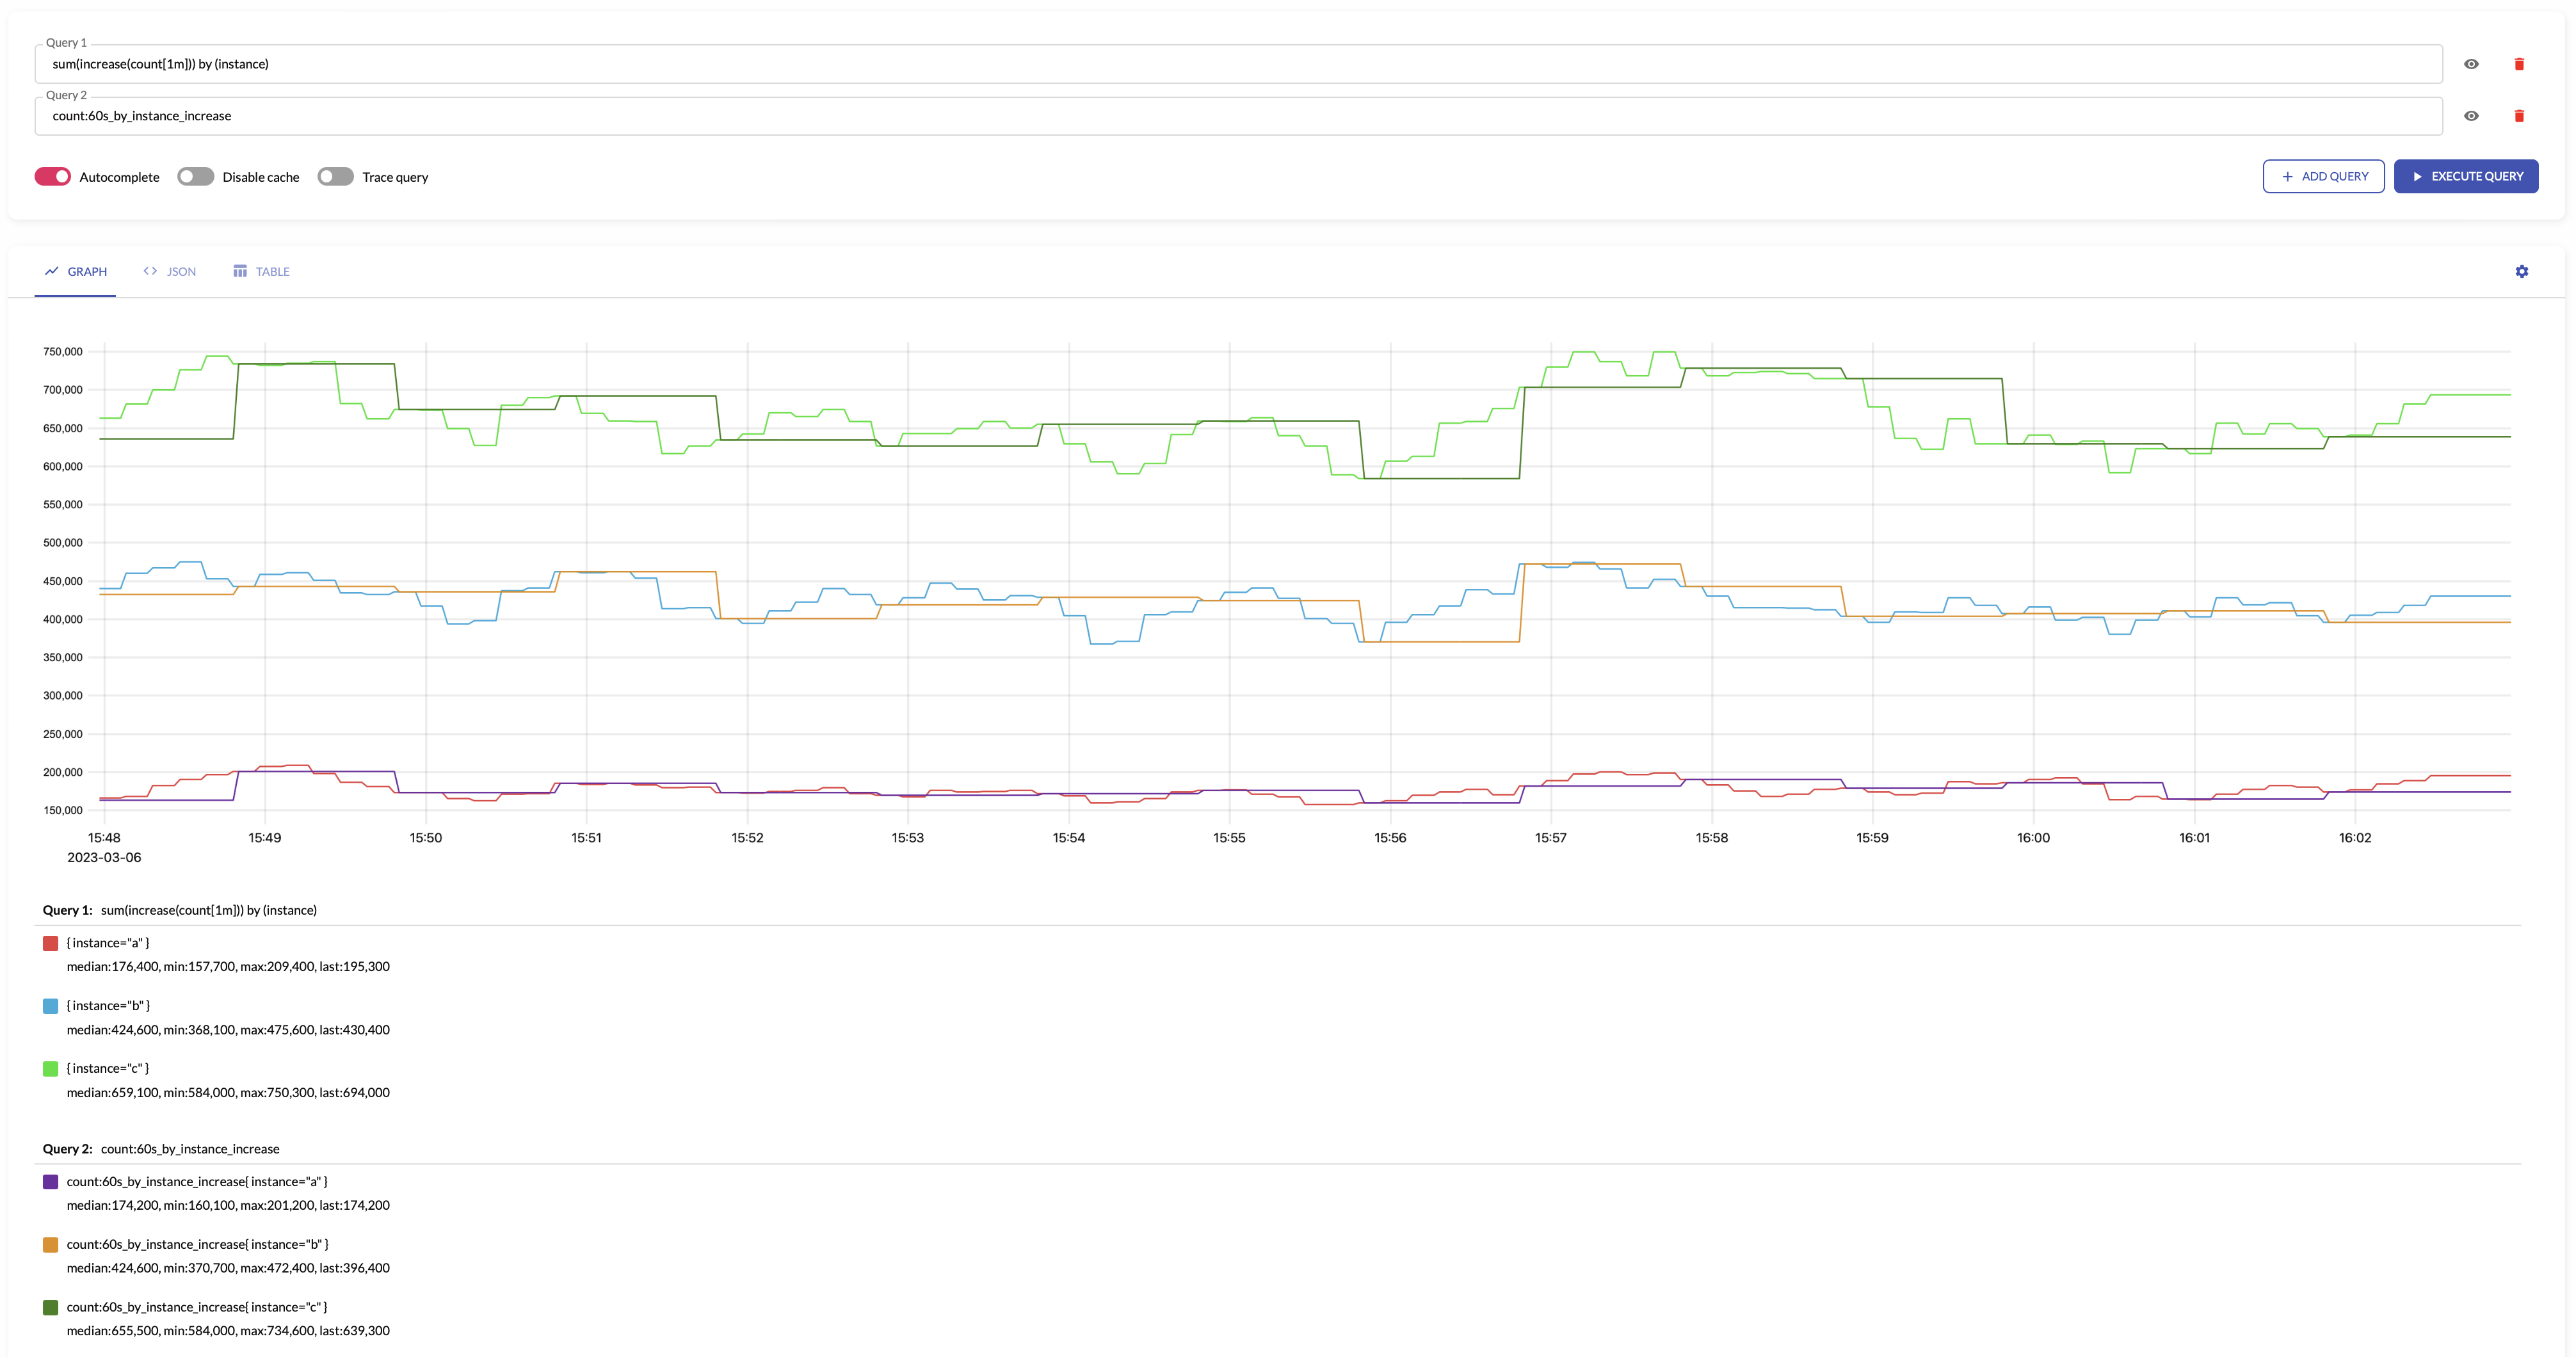
increase can be used as an alternative for rate function.
For example, if we have increase with interval of 5m for a counter some_counter, then to get rate we should divide
the resulting aggregation by the interval in seconds: some_counter:5m_increase / 5m is similar to rate(some_counter[5m]).
Please note, opposite to rate, increase aggregations can be
combined safely afterwards. This is helpful when the aggregation is calculated by more than one vmagent.
Aggregating irregular and sporadic metrics (received from Lambdas or Cloud Functions) can be controlled via staleness_inteval.
count_series
count_series counts the number of unique time series.
The results of count_series is equal to the count(some_metric) query.
count_samples
count_samples counts the number of input samples.
The results of count_samples with aggregation interval of 1m is equal to the count_over_time(some_metric[1m]) query.
sum_samples
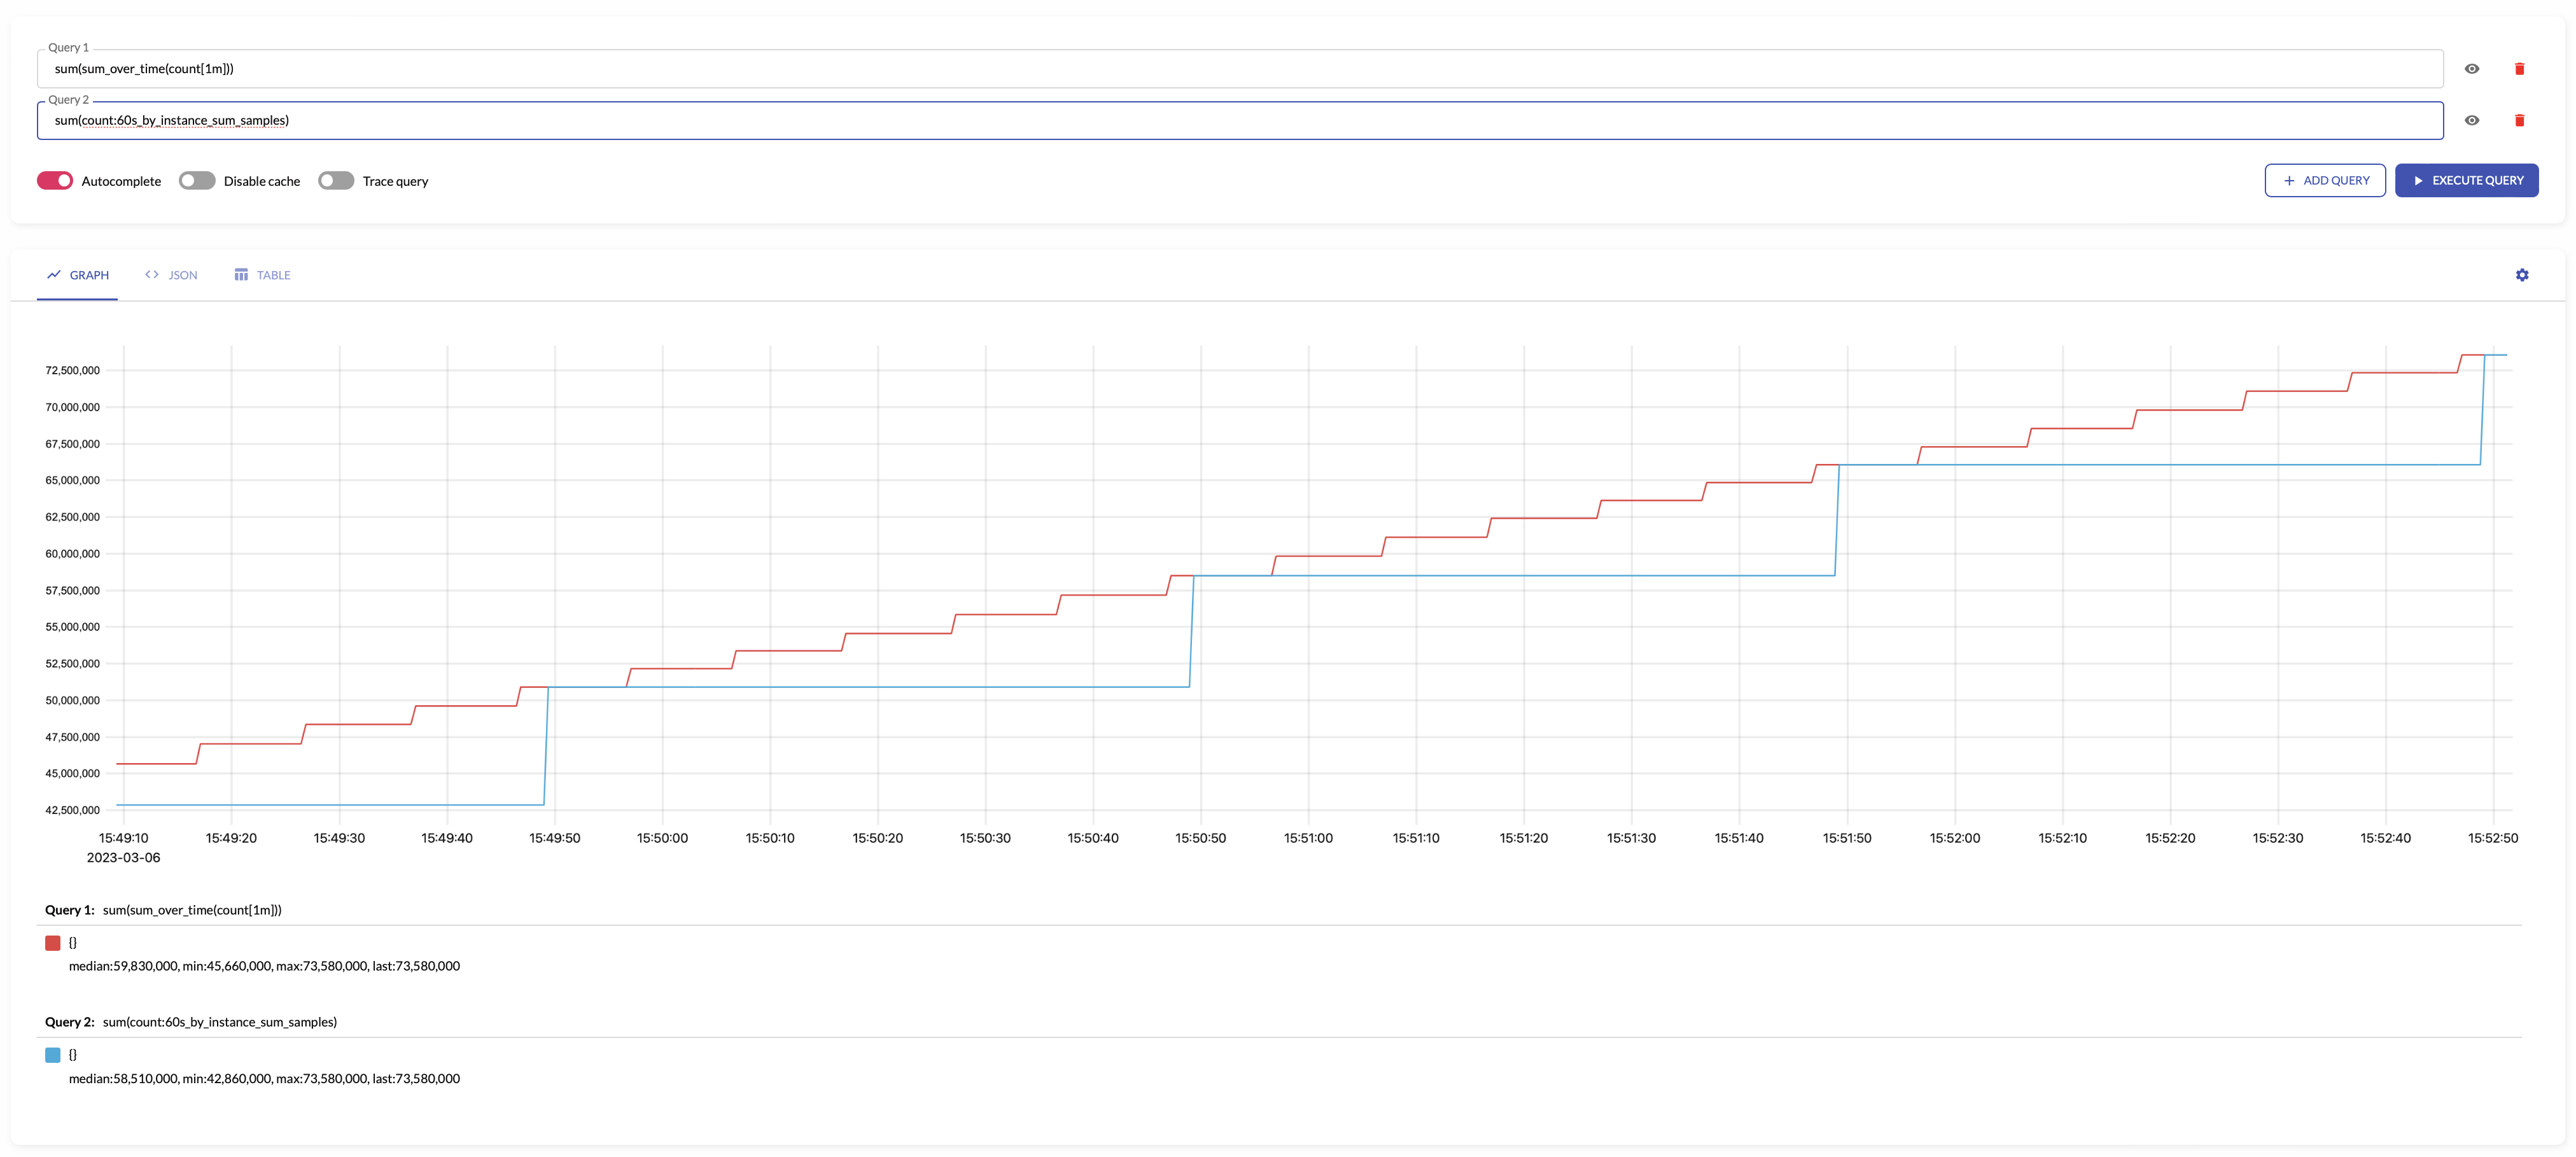
sum_samples sums input sample values.
sum_samples makes sense only for aggregating gauge metrics.
The results of sum_samples with aggregation interval of 1m is equal to the sum_over_time(some_metric[1m]) query.
For example, see below time series produced by config with aggregation interval 1m and the regular query:
last
last returns the last input sample value.
The results of last with aggregation interval of 1m is equal to the last_over_time(some_metric[1m]) query.
This aggregation output doesn't make much sense with by lists specified in the config.
The result of aggregation by labels in this case will be undetermined, because it depends on the order of processing the time series.
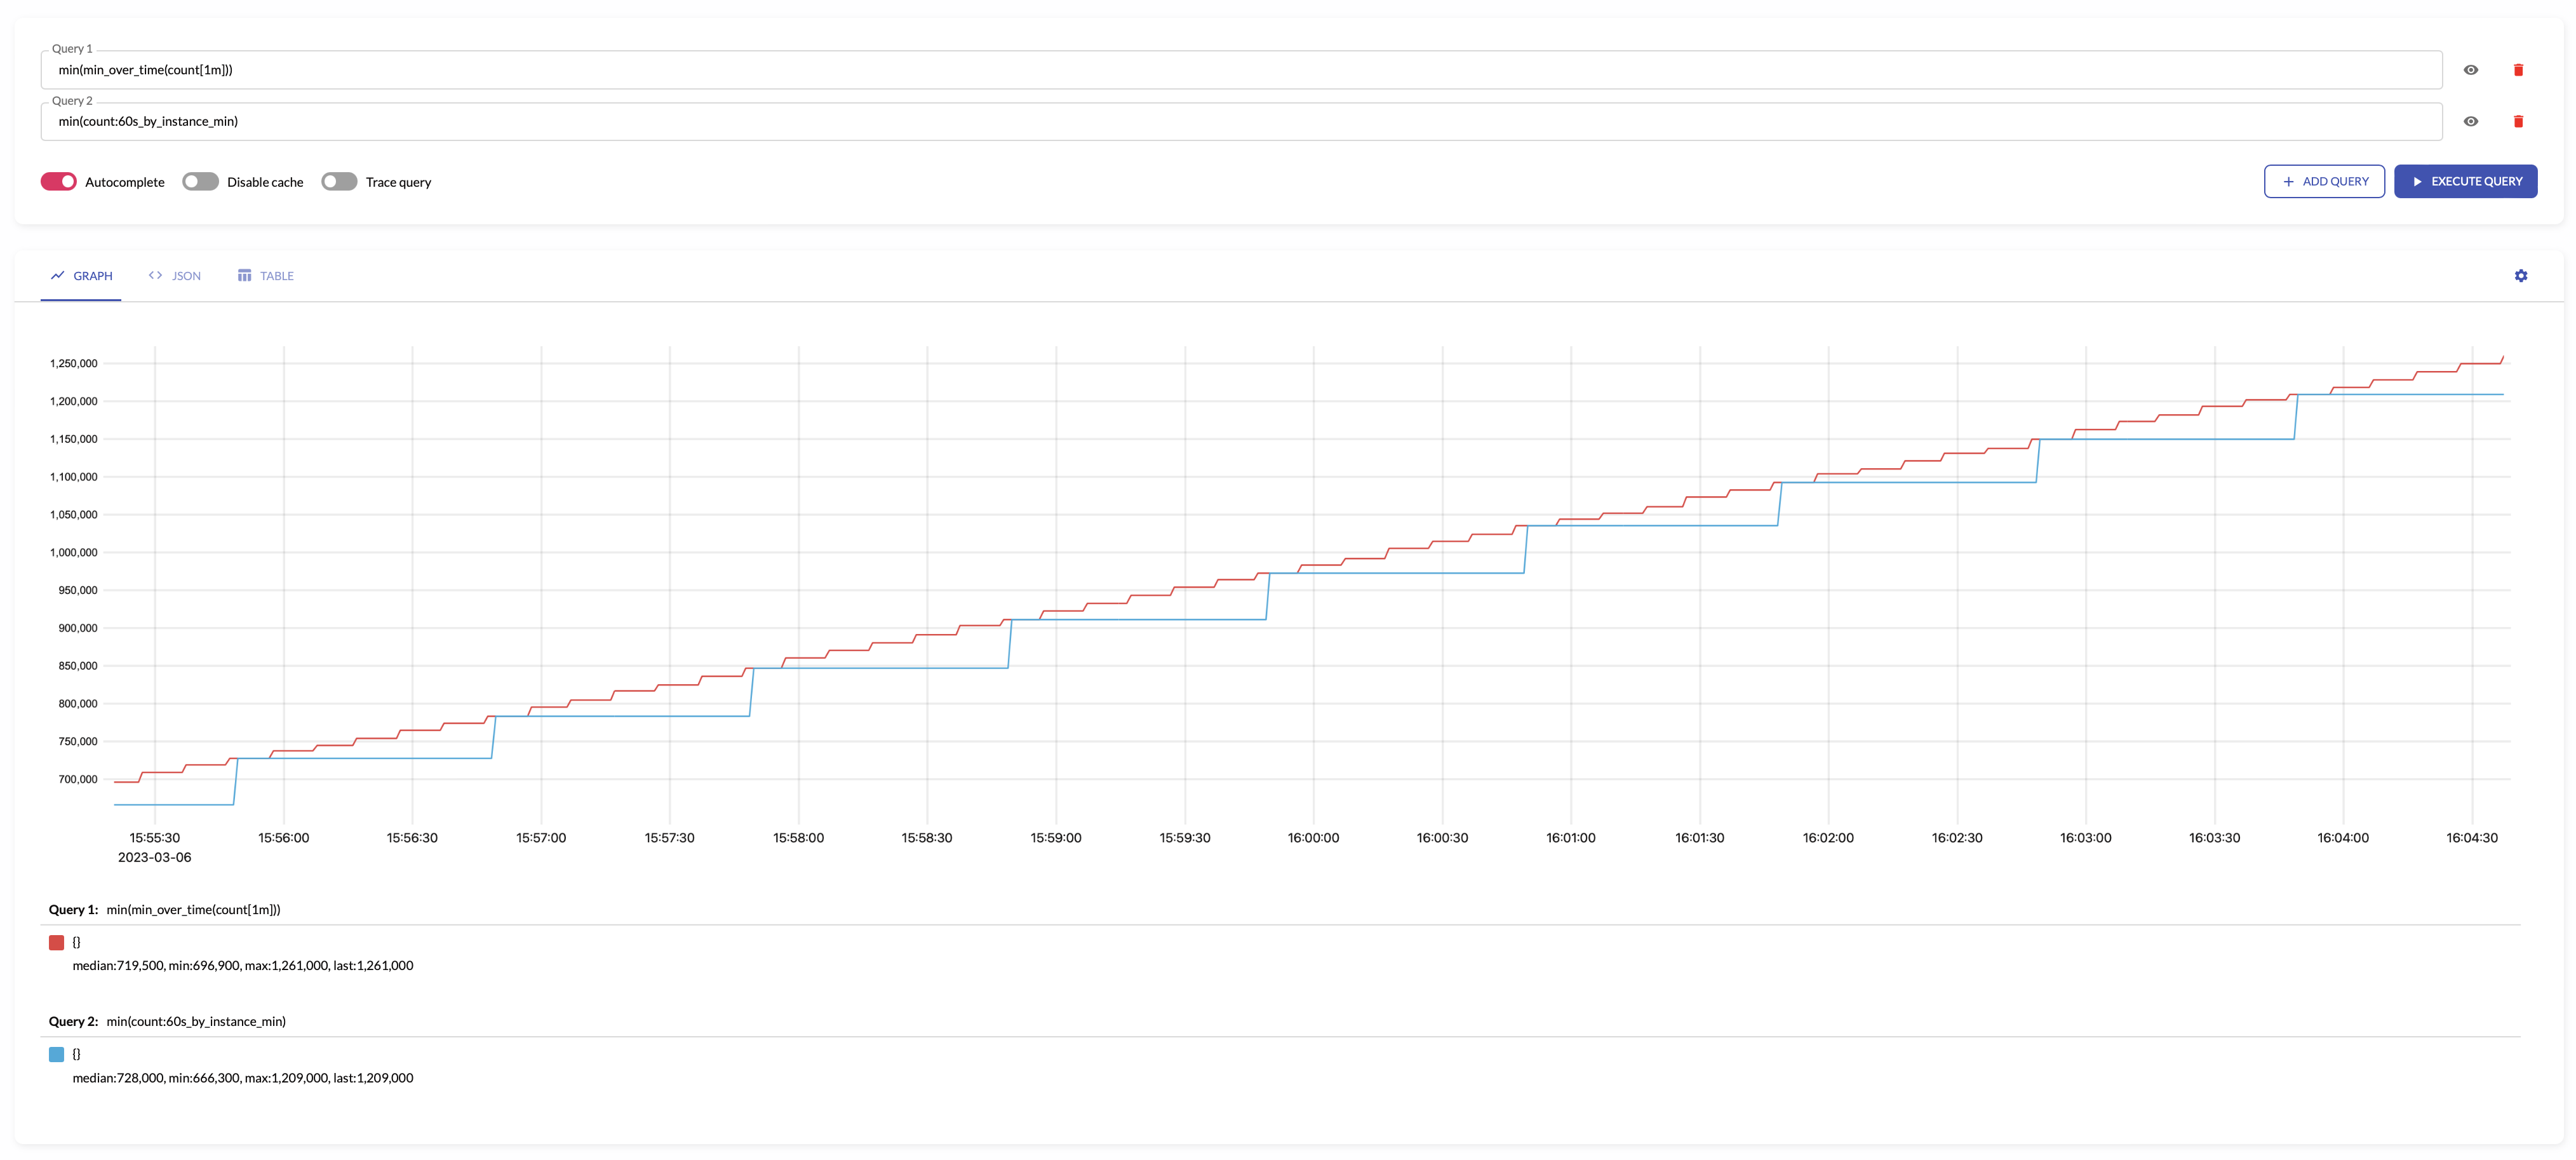
min
min returns the minimum input sample value.
The results of min with aggregation interval of 1m is equal to the min_over_time(some_metric[1m]) query.
For example, see below time series produced by config with aggregation interval 1m and the regular query:
max
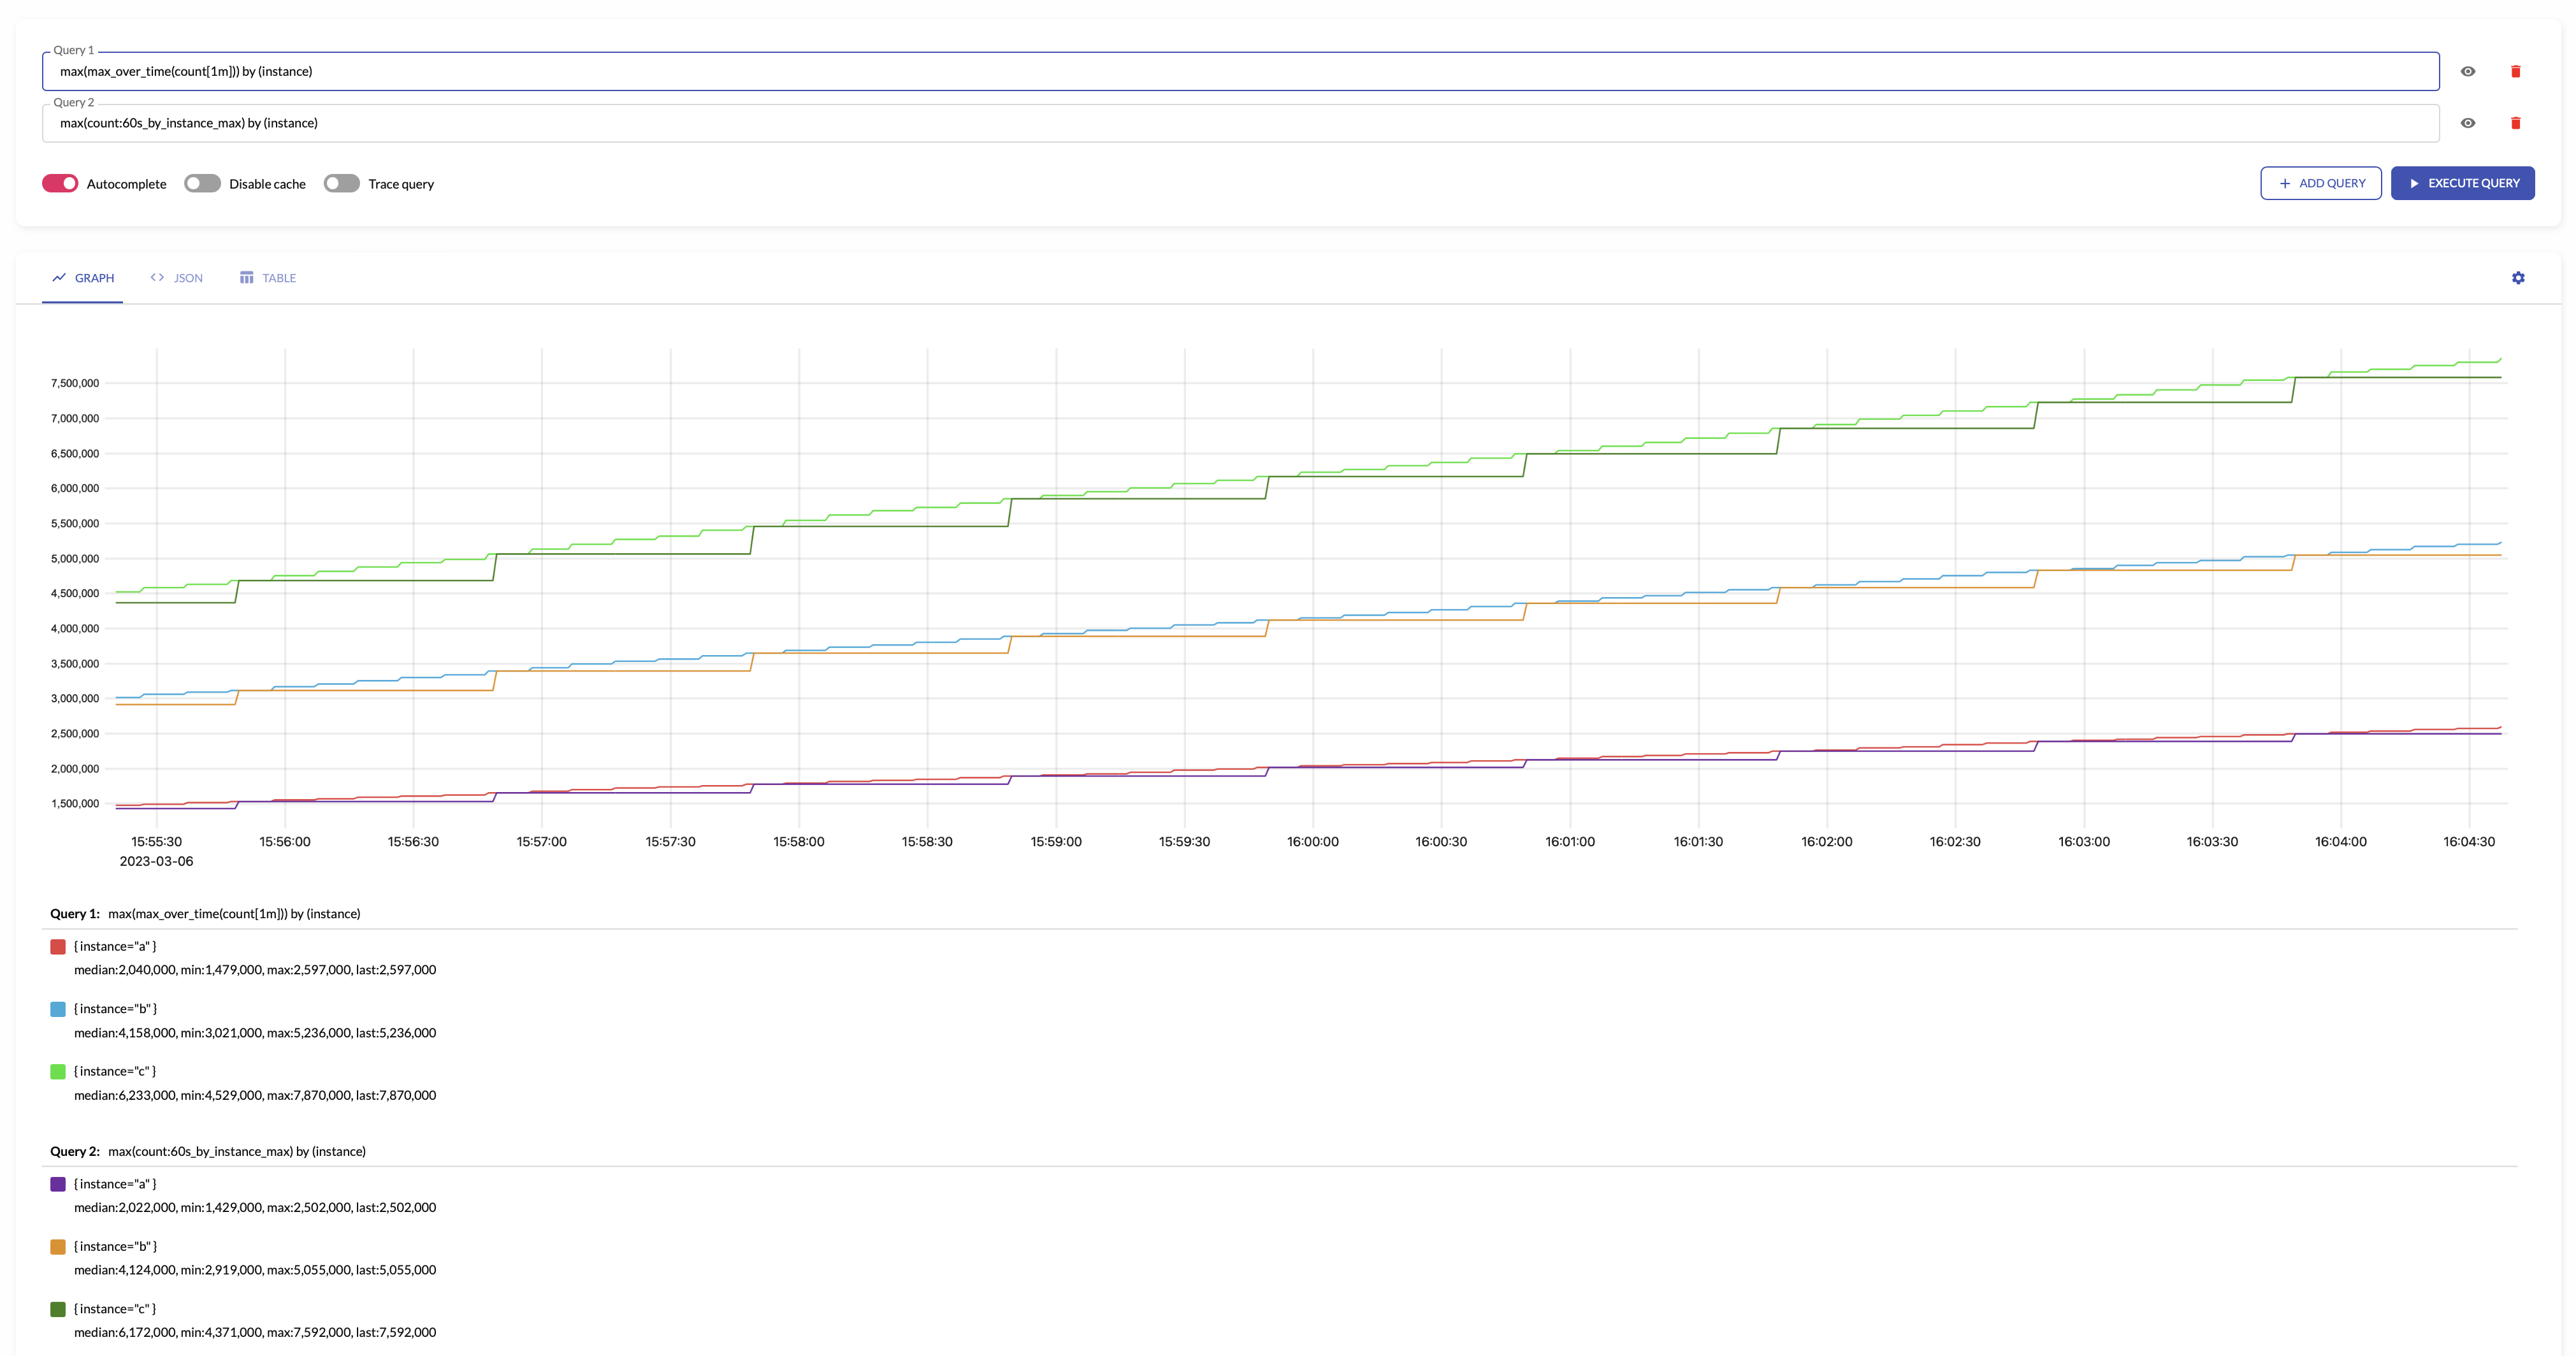
max returns the maximum input sample value.
The results of max with aggregation interval of 1m is equal to the max_over_time(some_metric[1m]) query.
For example, see below time series produced by config with aggregation interval 1m and the regular query:
avg
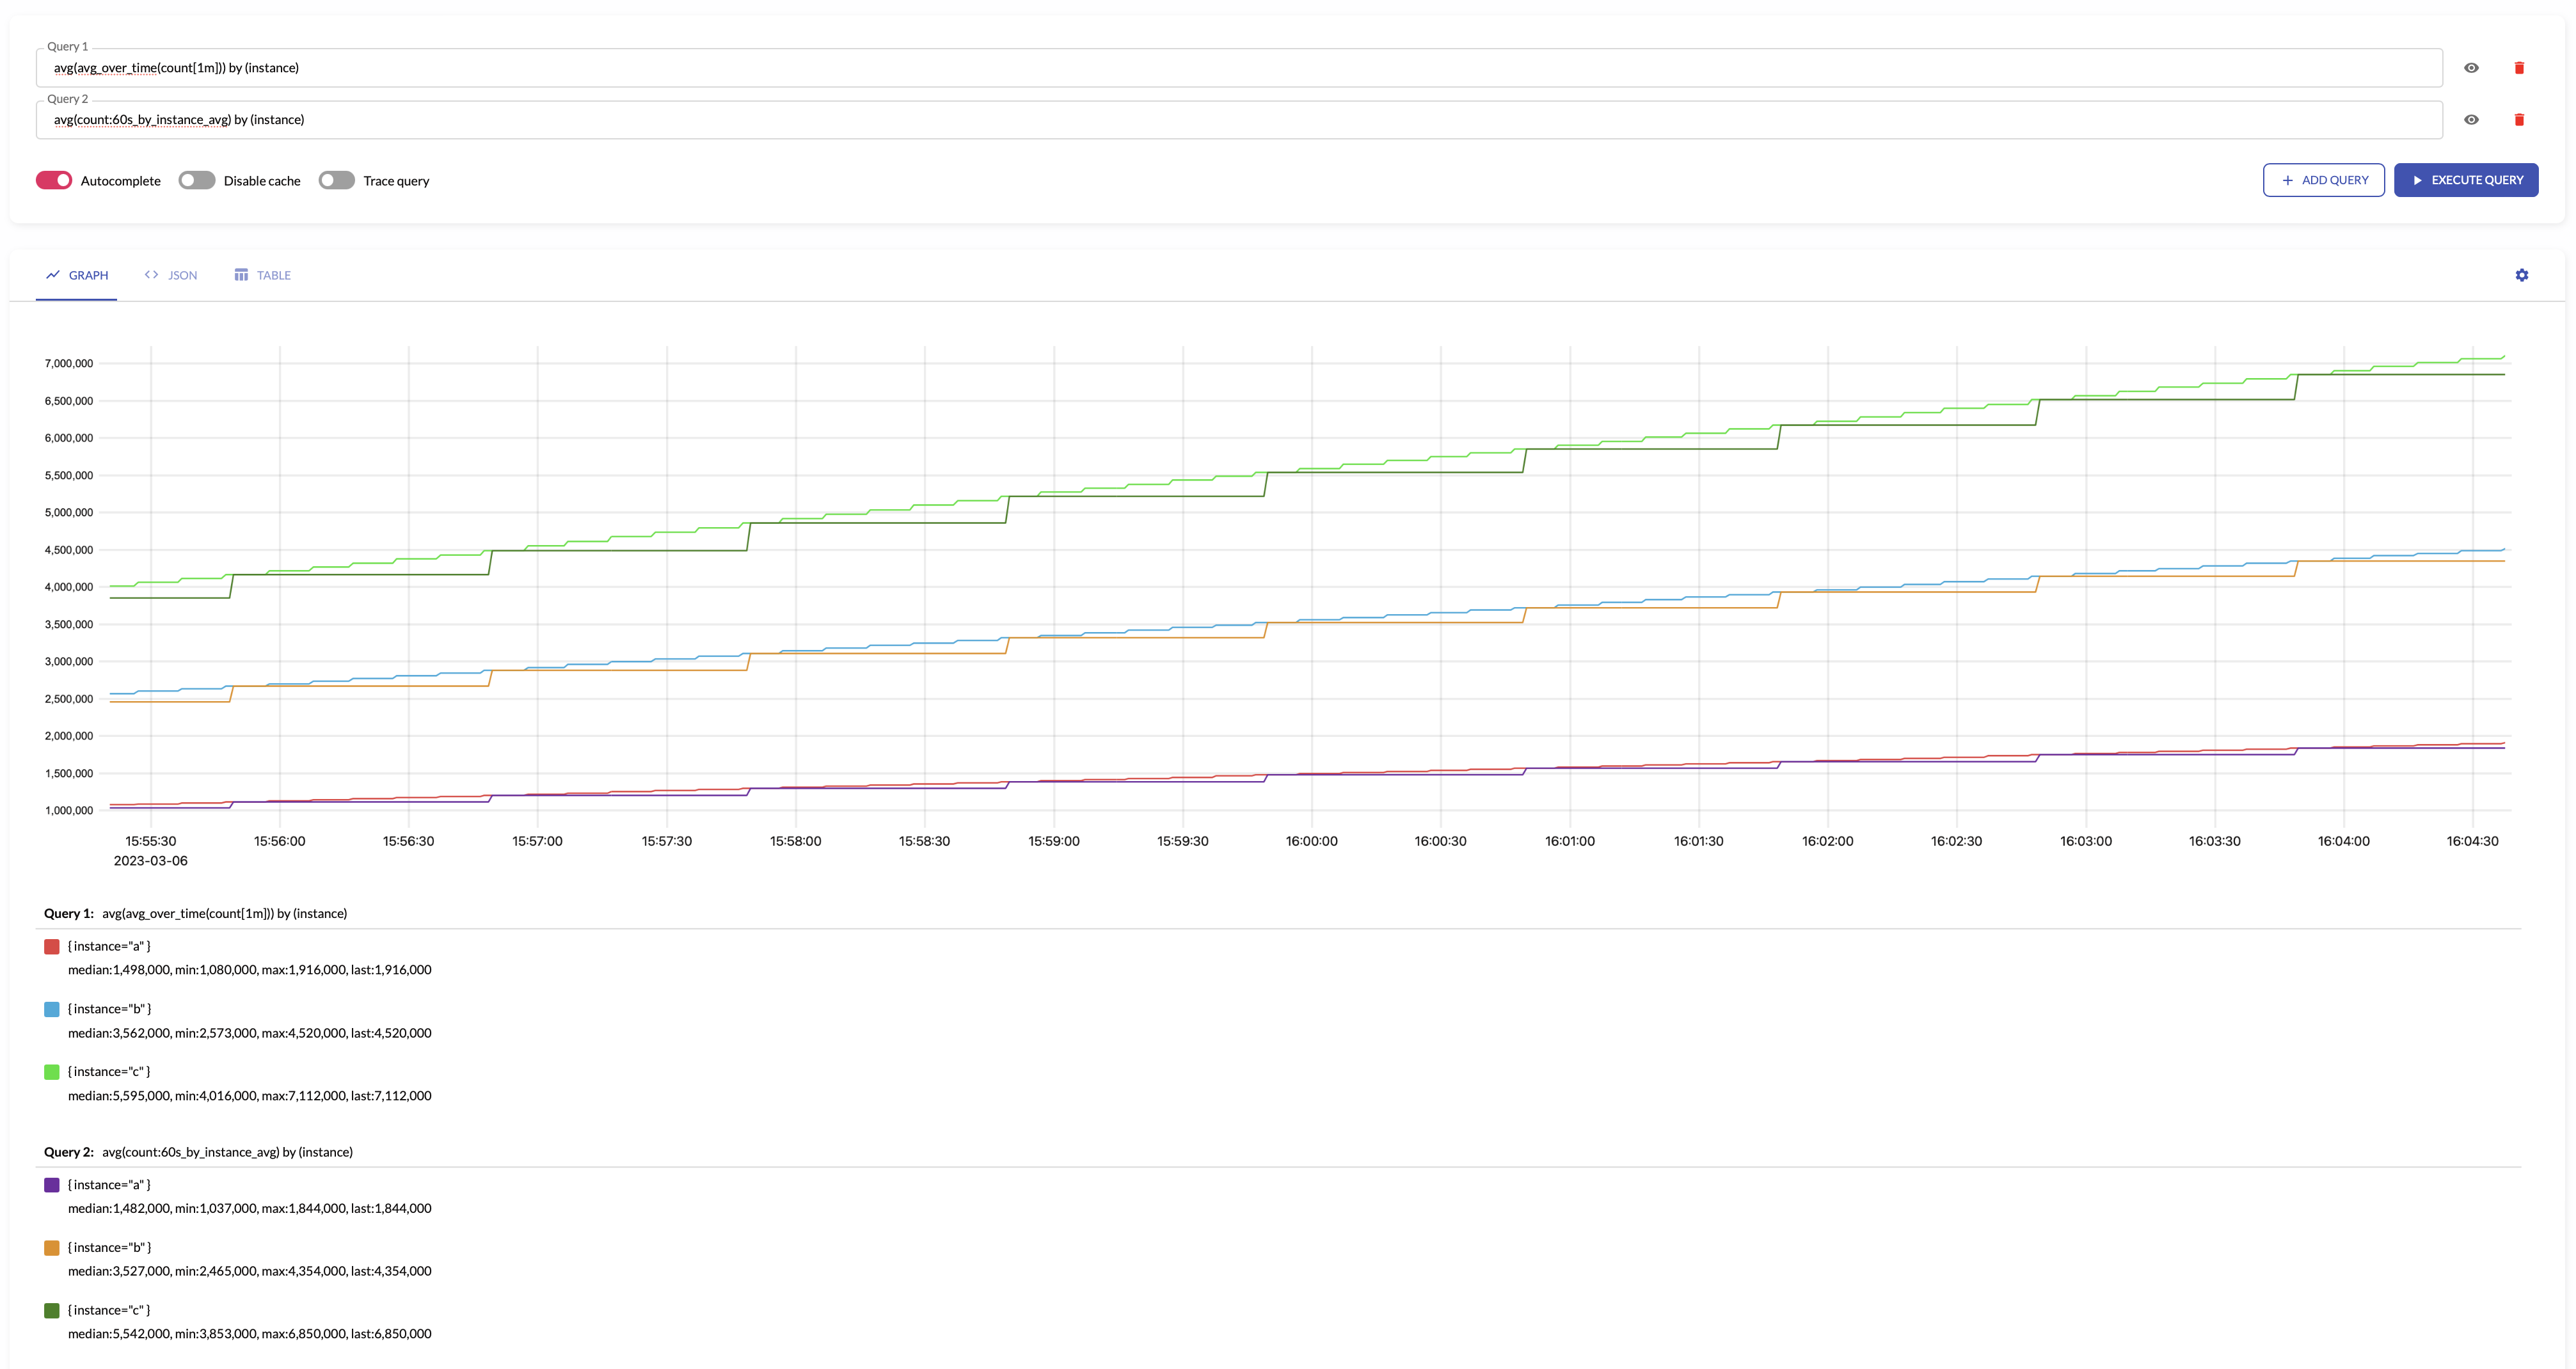
avg returns the average input sample value.
The results of avg with aggregation interval of 1m is equal to the avg_over_time(some_metric[1m]) query.
For example, see below time series produced by config with aggregation interval 1m and by: ["instance"] and the regular query:
stddev
stddev returns standard deviation for the input sample values.
stddev makes sense only for aggregating gauge metrics.
The results of stddev with aggregation interval of 1m is equal to the stddev_over_time(some_metric[1m]) query.
stdvar
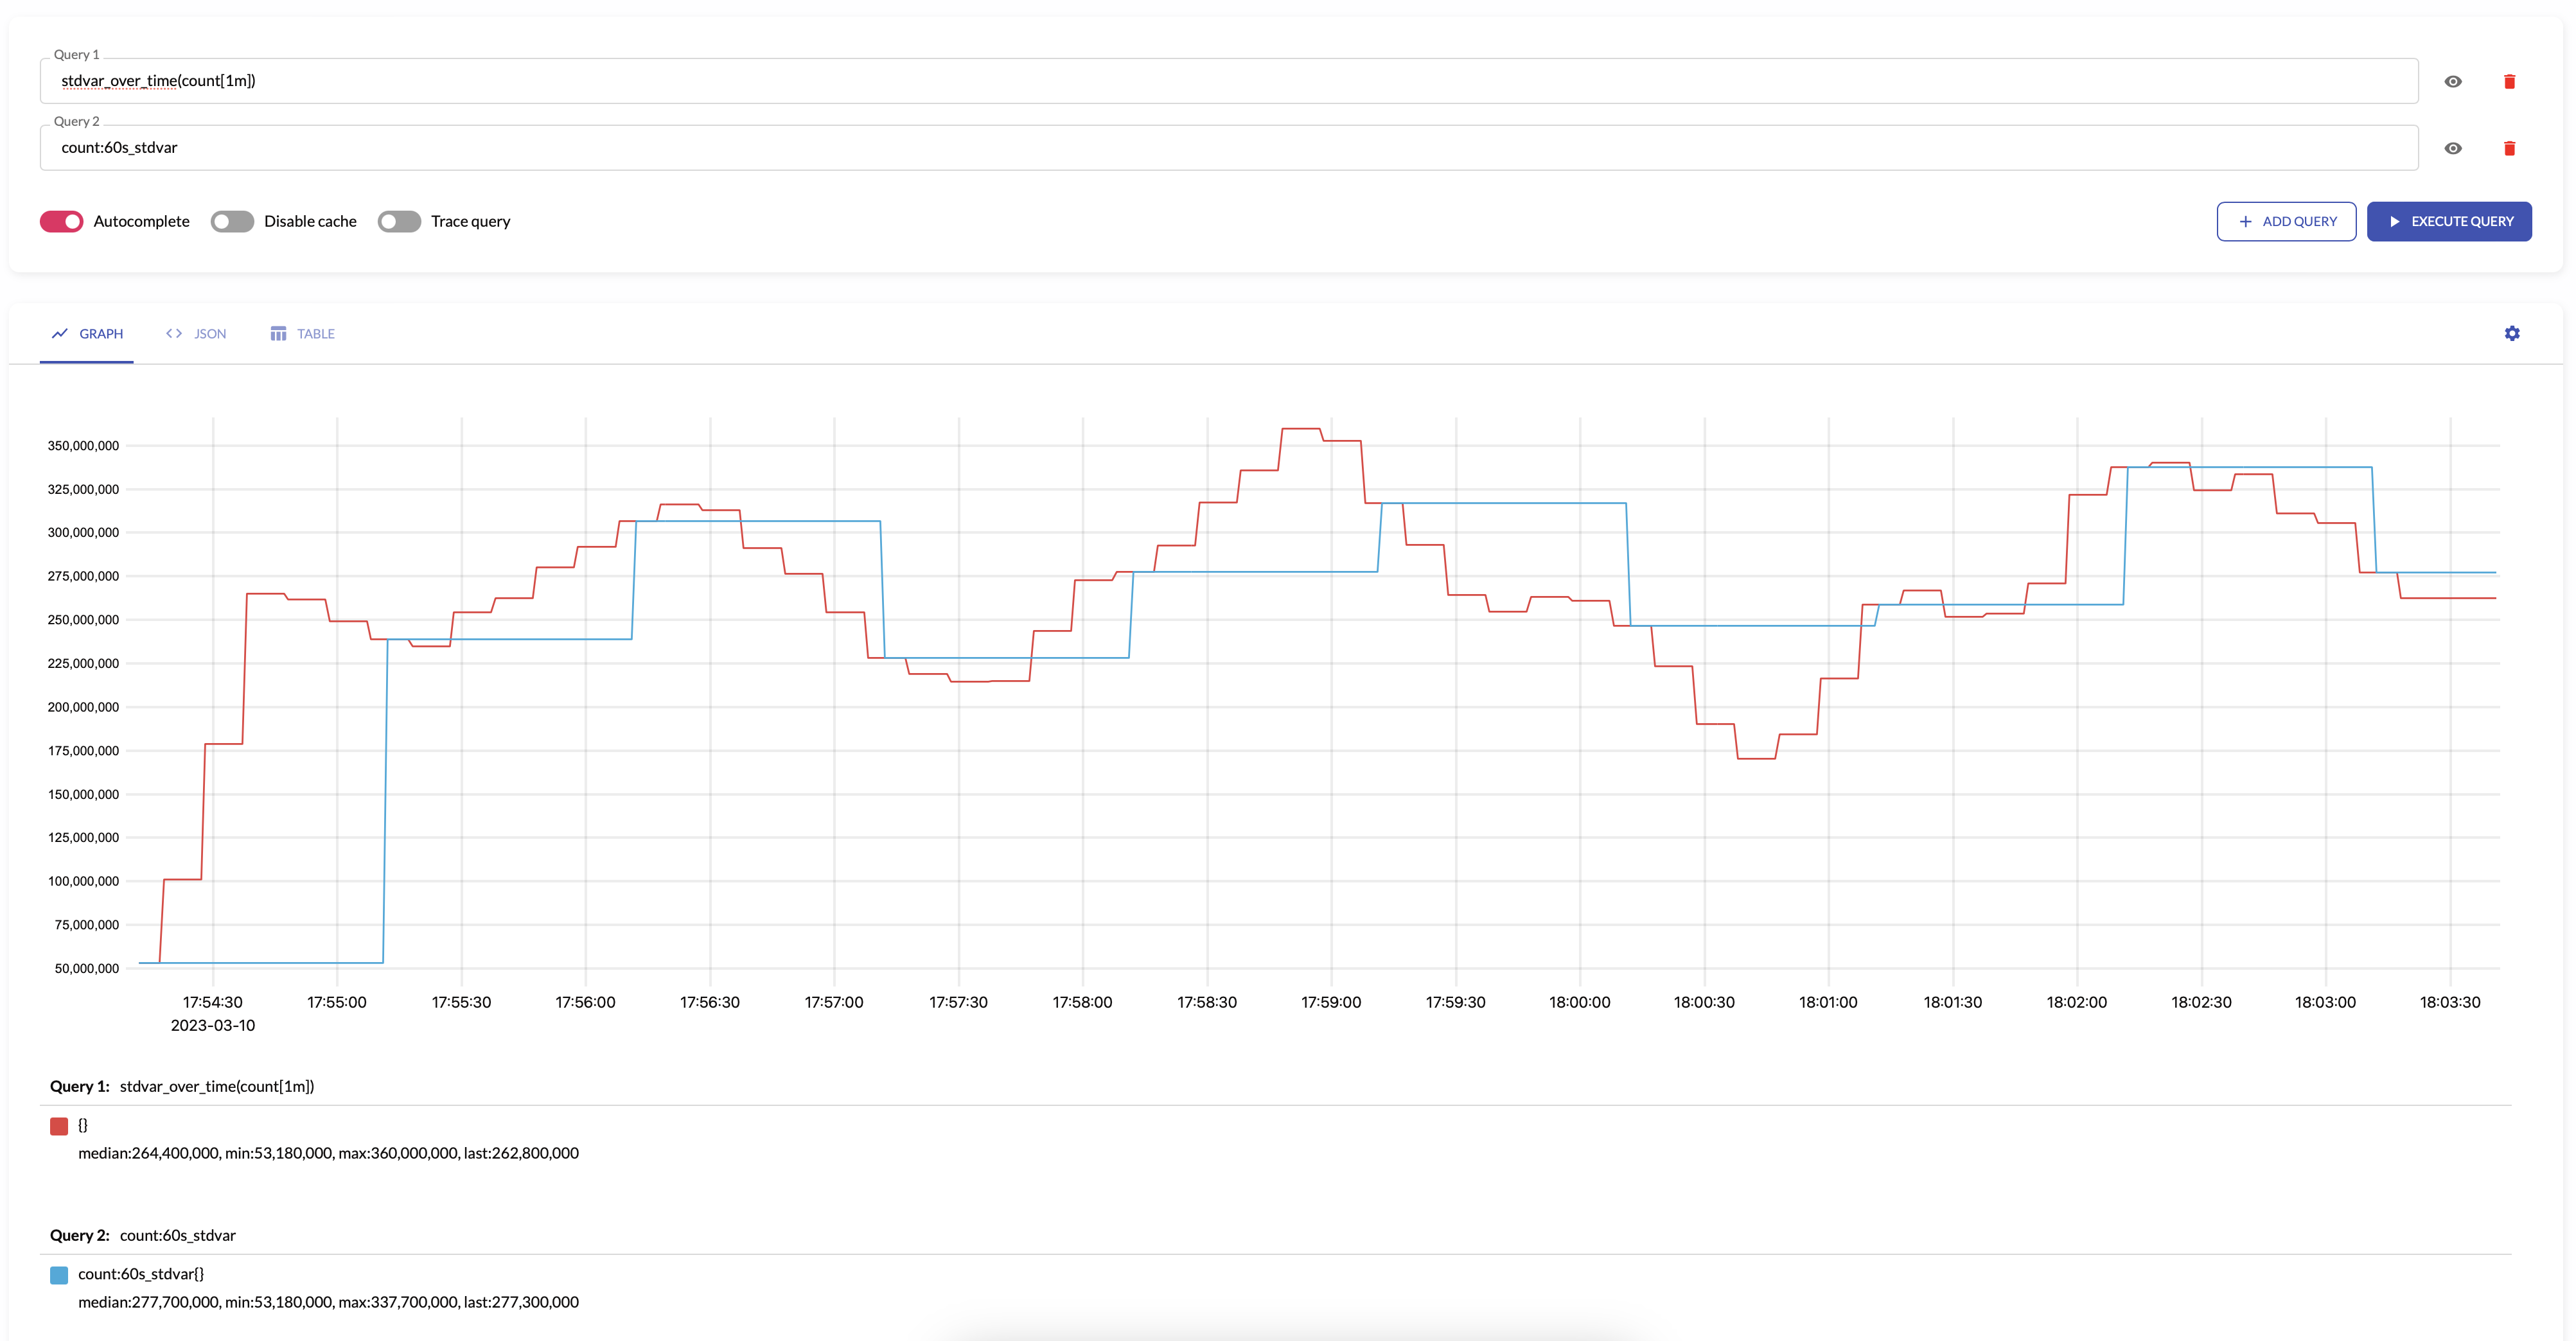
stdvar returns standard variance for the input sample values.
stdvar makes sense only for aggregating gauge metrics.
The results of stdvar with aggregation interval of 1m is equal to the stdvar_over_time(some_metric[1m]) query.
For example, see below time series produced by config with aggregation interval 1m and the regular query:
histogram_bucket
histogram_bucket returns VictoriaMetrics histogram buckets
for the input sample values.
histogram_bucket makes sense only for aggregating gauge metrics.
See how to aggregate regular histograms here.
The results of histogram_bucket with aggregation interval of 1m is equal to the histogram_over_time(some_histogram_bucket[1m]) query.
Aggregating irregular and sporadic metrics (received from Lambdas or Cloud Functions) can be controlled via staleness_inteval.
quantiles
quantiles(phi1, ..., phiN) returns percentiles for the given phi*
over the input sample values.
The phi must be in the range [0..1], where 0 means 0th percentile, while 1 means 100th percentile.
quantiles(...) makes sense only for aggregating gauge metrics.
The results of quantiles(phi1, ..., phiN) with aggregation interval of 1m
is equal to the quantiles_over_time("quantile", phi1, ..., phiN, some_histogram_bucket[1m]) query.
Please note, quantiles aggregation won't produce correct results when vmagent is in cluster mode
since percentiles should be calculated only on the whole matched data set.
Aggregating by labels
All the labels for the input metrics are preserved by default in the output metrics. For example,
the input metric foo{app="bar",instance="host1"} results to the output metric foo:1m_sum_samples{app="bar",instance="host1"}
when the following stream aggregation config is used:
- interval: 1m
  outputs: [sum_samples]
The input labels can be removed via without list specified in the config. For example, the following config
removes the instance label from output metrics by summing input samples across all the instances:
- interval: 1m
  without: [instance]
  outputs: [sum_samples]
In this case the foo{app="bar",instance="..."} input metrics are transformed into foo:1m_without_instance_sum_samples{app="bar"}
output metric according to output metric naming.
It is possible specifying the exact list of labels in the output metrics via by list.
For example, the following config sums input samples by the app label:
- interval: 1m
  by: [app]
  outputs: [sum_samples]
In this case the foo{app="bar",instance="..."} input metrics are transformed into foo:1m_by_app_sum_samples{app="bar"}
output metric according to output metric naming.
The labels used in by and without lists can be modified via input_relabel_configs section - see these docs.
See also aggregation outputs.
Stream aggregation config
Below is the format for stream aggregation config file, which may be referred via -remoteWrite.streamAggr.config command-line flag
at vmagent or via -streamAggr.config command-line flag
at single-node VictoriaMetrics:
  # match is an optional filter for incoming samples to aggregate.
  # It can contain arbitrary Prometheus series selector
  # according to https://docs.victoriametrics.com/keyConcepts.html#filtering .
  # If match isn't set, then all the incoming samples are aggregated.
  #
  # match also can contain a list of series selectors. Then the incoming samples are aggregated
  # if they match at least a single series selector.
  #
- match: 'http_request_duration_seconds_bucket{env=~"prod|staging"}'

  # interval is the interval for the aggregation.
  # The aggregated stats is sent to remote storage once per interval.
  #
  interval: 1m

  # staleness_interval defines an interval after which the series state will be reset if no samples have been sent during it.
  # It means that:
  # - no data point will be written for a resulting time series if it didn't receive any updates during configured interval,
  # - if the series receives updates after the configured interval again, then the time series will be calculated from the initial state
  #   (it's like this series didn't exist until now).
  # Increase this parameter if it is expected for matched metrics to be delayed or collected with irregular intervals exceeding the `interval` value.
  # By default, is equal to x2 of the `interval` field.
  # The parameter is only relevant for outputs: total, increase and histogram_bucket.
  #
  # staleness_interval: 2m

  # without is an optional list of labels, which must be removed from the output aggregation.
  # See https://docs.victoriametrics.com/stream-aggregation.html#aggregating-by-labels
  #
  without: [instance]

  # by is an optional list of labels, which must be preserved in the output aggregation.
  # See https://docs.victoriametrics.com/stream-aggregation.html#aggregating-by-labels
  #
  # by: [job, vmrange]

  # outputs is the list of aggregations to perform on the input data.
  # See https://docs.victoriametrics.com/stream-aggregation.html#aggregation-outputs
  #
  outputs: [total]

  # input_relabel_configs is an optional relabeling rules,
  # which are applied to the incoming samples after they pass the match filter
  # and before being aggregated.
  # See https://docs.victoriametrics.com/stream-aggregation.html#relabeling
  #
  input_relabel_configs:
  - target_label: vmaggr
    replacement: before

  # output_relabel_configs is an optional relabeling rules,
  # which are applied to the aggregated output metrics.
  #
  output_relabel_configs:
  - target_label: vmaggr
    replacement: after
The file can contain multiple aggregation configs. The aggregation is performed independently per each specified config entry.
Configuration update
vmagent and single-node VictoriaMetrics
support the following approaches for hot reloading stream aggregation configs from -remoteWrite.streamAggr.config and -streamAggr.config:
-
By sending
SIGHUPsignal tovmagentorvictoria-metricsprocess:kill -SIGHUP `pidof vmagent` -
By sending HTTP request to
/-/reloadendpoint (e.g.http://vmagent:8429/-/reloador `http://victoria-metrics:8428/-/reload).
Cluster mode
If you use vmagent in cluster mode for streaming aggregation
(with -promscrape.cluster.* parameters or with VMAgent.spec.shardCount > 1 for vmoperator)
then be careful when aggregating metrics via by, without or modifying via *_relabel_configs parameters, since incorrect usage
may result in duplicates and data collision. For example, if more than one vmagent instance calculates increase for metric http_requests_total
with by: [path] directive, then all the vmagent instances will aggregate samples to the same set of time series with different path labels.
The proper fix would be to add an unique -remoteWrite.label per each vmagent,
so every vmagent aggregates data into distinct set of time series. These time series then can be aggregated later as needed during querying.
For example, if vmagent instances run in Docker or Kubernetes, then you can refer POD_NAME or HOSTNAME environment variables
as an unique label value per each vmagent: -remoteWrite.label='vmagent=%{HOSTNAME} . See these docs
on how to refer environment variables in VictoriaMetrics components.