* docs: remove witdh from images, remove <p>, remove <div>

Signed-off-by: Artem Navoiev <tenmozes@gmail.com>

* docs: remove <div> clarify language in code blocks

Signed-off-by: Artem Navoiev <tenmozes@gmail.com>

---------

Signed-off-by: Artem Navoiev <tenmozes@gmail.com>
5.4 KiB
| sort | weight | title | menu | aliases | |||||||
|---|---|---|---|---|---|---|---|---|---|---|---|
| 3 | 3 | Kubernetes Monitoring with Managed VictoriaMetrics |
|
|
Kubernetes Monitoring with Managed VictoriaMetrics
Monitoring kubernetes cluster is necessary to build SLO/SLI, to analyze performance and cost-efficiency of your workloads.
To enable kubernetes cluster monitoring, we will be collecting metrics about cluster performance and utilization from kubernetes components like kube-api-server, kube-controller-manager, kube-scheduler, kube-state-metrics, etcd, core-dns, kubelet and kube-proxy. We will also install some recording rules, alert rules and dashboards to provide visibility of cluster performance, as well as alerting for cluster metrics.
For node resource utilization we will be collecting metrics from node-exporter. We will also install dashboard and alerts for node related metrics
For workloads monitoring in kubernetes cluster we will have VictoriaMetrics Operator. It enables us to define scrape jobs using kubernetes CRDs VMServiceScrape, VMPodScrape. To add alerts or recording rules for workloads we can use VMRule CRD
Overview
In this guide we will be using victoria-metrics-k8s-stack helm chart
This chart will install VMOperator, VMAgent, NodeExporter, kube-state-metrics, grafana and some service scrape configurations to start monitoring kubernetes cluster components
Prerequisites
- Active Managed VictoriaMetrics instance. You can learn how to signup for Managed VictoriaMetrics here.
- Access to your kubernetes cluster
- Helm binary. You can find installation here
Installation steps
Install the Helm chart in a custom namespace
-
Create a unique Kubernetes namespace, for example
monitoringkubectl create namespace monitoring -
Create kubernetes-secrets with token to access your dbaas deployment
kubectl --namespace monitoring create secret generic dbaas-write-access-token --from-literal=bearerToken=your-token
kubectl --namespace monitoring create secret generic dbaas-read-access-token --from-literal=bearerToken=your-token
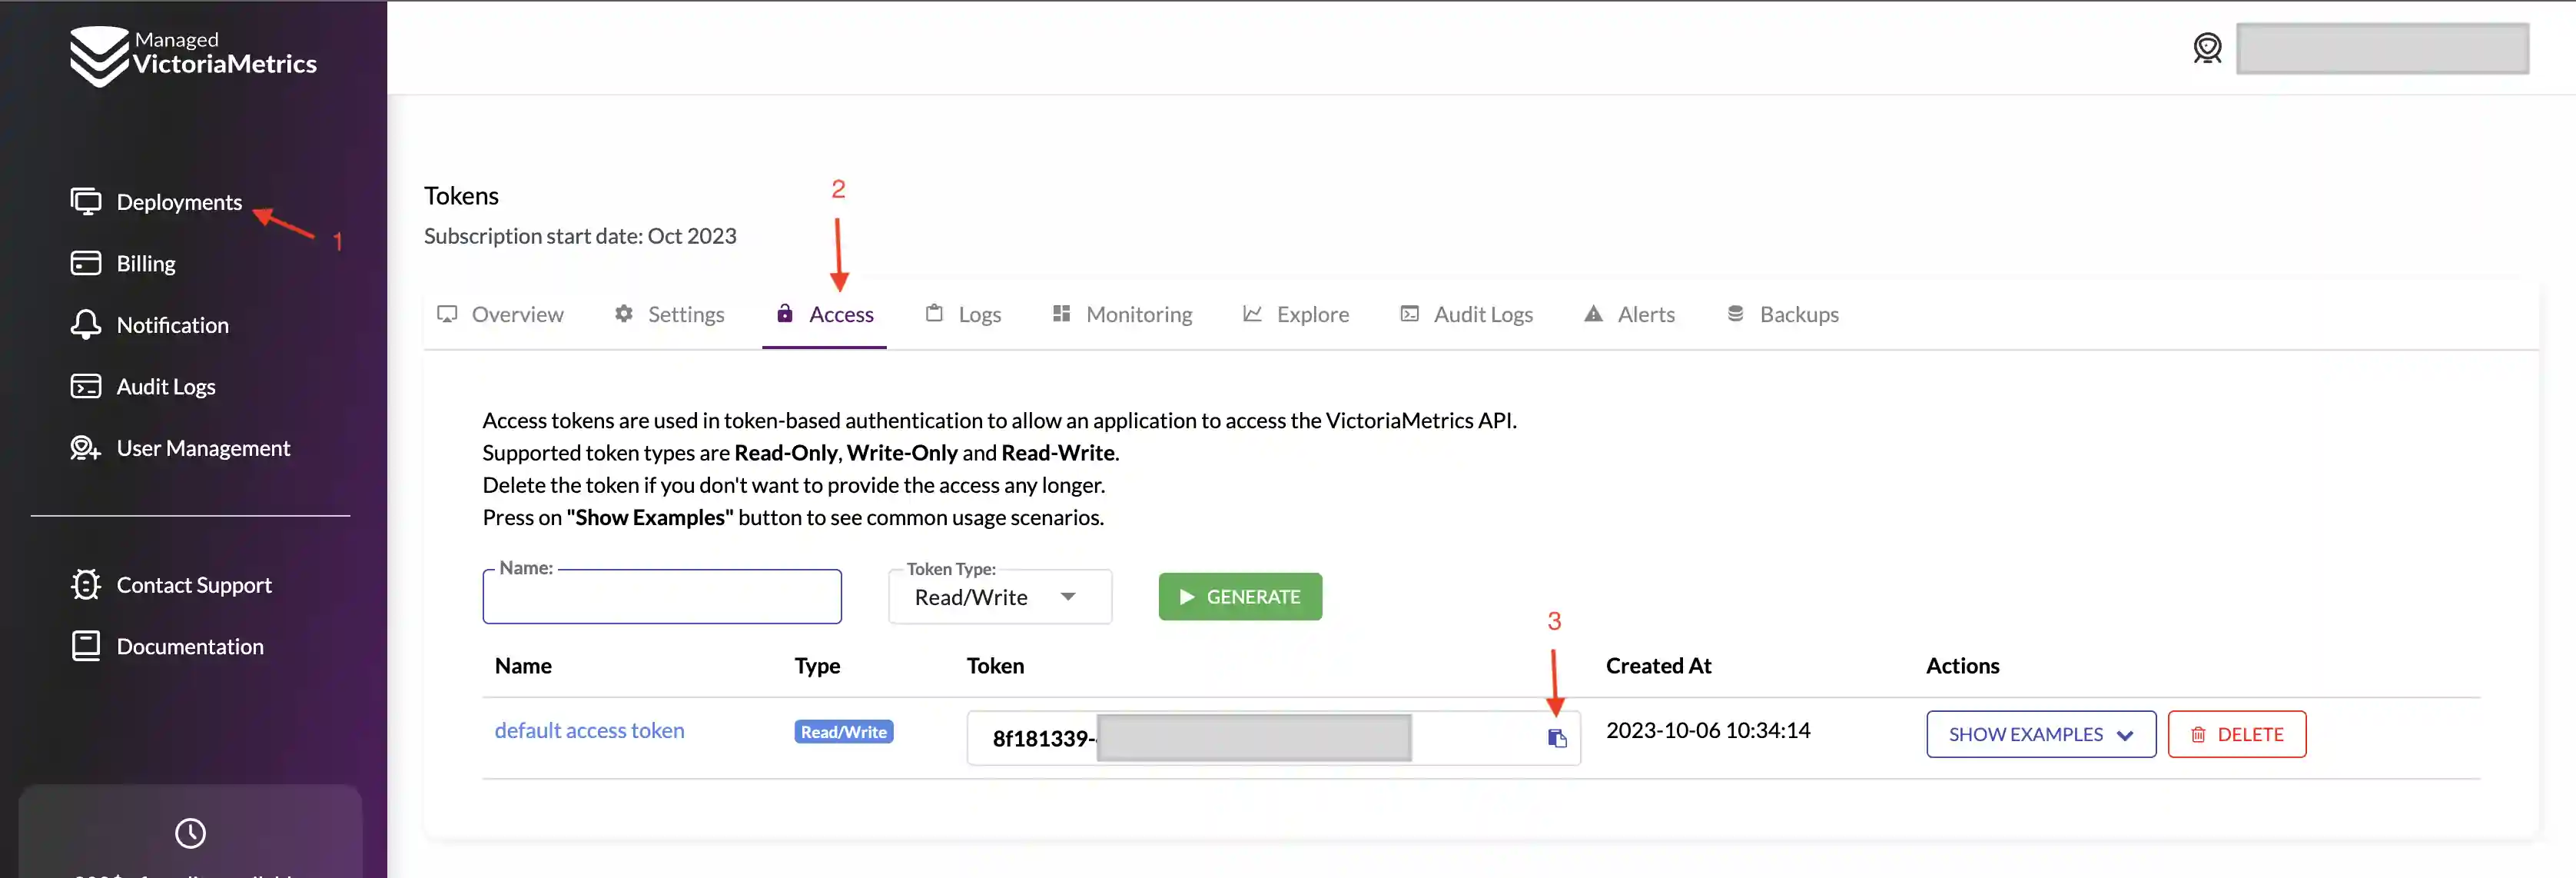
You can find your access token on the "Access" tab of your deployment

-
Set up a Helm repository using the following commands:
helm repo add grafana https://grafana.github.io/helm-charts helm repo add prometheus-community https://prometheus-community.github.io/helm-charts helm repo add vm https://victoriametrics.github.io/helm-charts helm repo update -
Create a YAML file of Helm values called dbaas.yaml with following content
externalVM: read: url: <reading url, you can find it in examples on Access page> bearerTokenSecret: name: dbaas-write-access-token key: bearerToken write: url: <reading url, you can find it in examples on Access page> bearerTokenSecret: name: dbaas-read-access-token key: bearerToken vmsingle: enabled: false vmcluster: enabled: false vmalert: enabled: true spec: evaluationInterval: 15s vmagent: enabled: true spec: scrapeInterval: 30s externalLabels: cluster: <your cluster name> # dependencies # Grafana dependency chart configuration. For possible values refer to https://github.com/grafana/helm-charts/tree/main/charts/grafana#configuration grafana: enabled: true -
Install VictoriaMetrics-k8s-stack helm chart
helm --namespace monitoring install vm vm/victoria-metrics-k8s-stack -f dbaas.yaml -n monitoring
Connect grafana
Connect to grafana and create your datasource
If you are using external grafana, you can skip steps 1-3 and you will need to import dashboards that can be found here manually
-
Get grafana password
kubectl --namespace monitoring get secret vm-grafana -o jsonpath="{.data.admin-password}" | base64 -d -
Connect to grafana
kubectl --namespace monitoring port-forward service/vm-grafana 3000:80 -
Open grafana in your browser http://localhost:3000/datasources
Use admin as username and password from previous step
-
Click on add datasource Choose VictoriaMetrics or Prometheus as datasource type. Make sure you made this datasource as default for dashboards to work.
You can find token and URL in your deployment, on Access tab

Test it
- You should be able to see data that was sent to your dbaas using VMAgent dashboard http://localhost:3000/d/G7Z9GzMGz/victoriametrics-vmagent/
- You also will be able to see bunch of kubernetes dashboards in your grafana