mirror of
https://github.com/VictoriaMetrics/VictoriaMetrics.git
synced 2024-12-18 22:52:11 +01:00
### Describe Your Changes

These changes were made as part of the title transition from Managed
VictoriaMetrics to VictoriaMetrics Cloud

### Checklist

The following checks are **mandatory**:

- [x] My change adheres [VictoriaMetrics contributing
guidelines](https://docs.victoriametrics.com/contributing/).

(cherry picked from commit d09182da11)
2.9 KiB
2.9 KiB
| title | weight | sort | menu | aliases | ||||||||||
|---|---|---|---|---|---|---|---|---|---|---|---|---|---|---|
| Proxmox | 1 | 1 |
|
|
Since Proxmox Virtual Environment(PVE) and Proxmox Backup Server(PBS) support sending data using the InfluxDB We can use the InfluxDB write support built into VictoriaMetrics Currently PVE and PBS only support using an Authorization Token for authentication and does not support basic auth or a username and password.
Proxmox Virtual Environment (PVE)
If want help Sending your data to VictoriaMetrics Cloud check out our blog.
- Login to PVE as an administrator
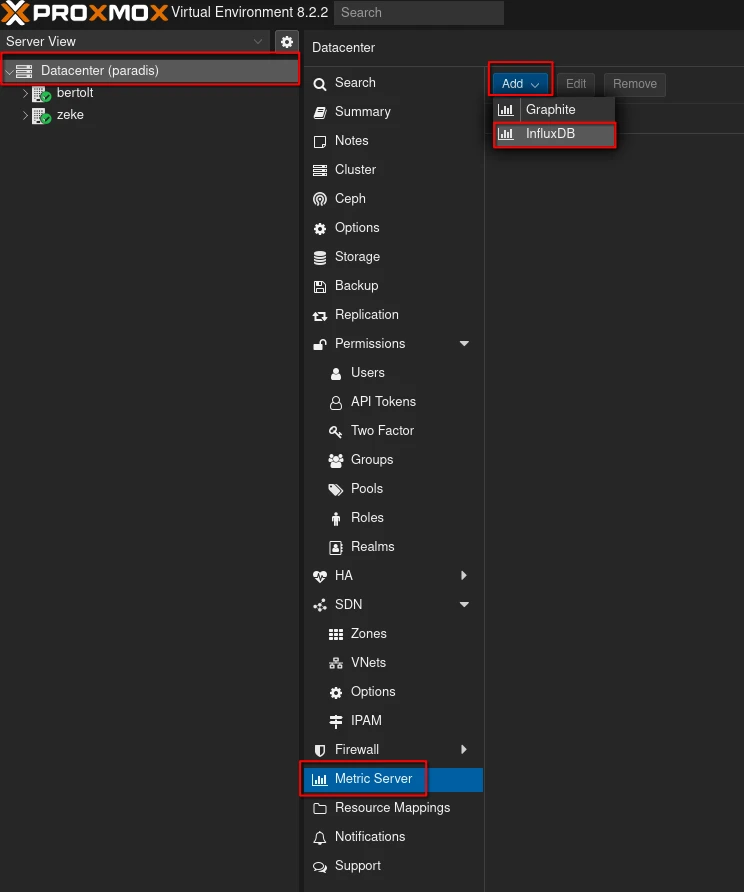
- Go to DataCenter > MetricServer > Add > InfluxDB
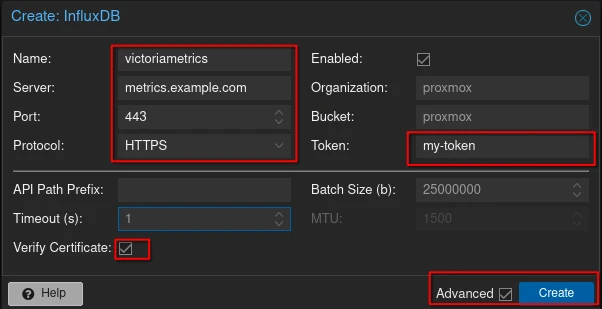
- Set the parameters as follows:
- Name: VictoriaMetrics (can be changed to any string)
- Server: the hostname or IP of your VictoriaMetrics Instance
- Port: This will vary depending how you are sending data to VictoriaMetrics, but the defaults for all components are listed in the data ingestion documentation
- Protocol: use HTTPS if you have TLS/SSL configured otherwise use HTTP
- Organization: leave empty since it doesn't get used
- Bucket: leave empty since it doesn't get used
- Token: your token from vmauth or leave blank if you don't have authentication enabled
- If you need to ignore TLS/SSL errors check the advanced box and uncheck the verify certificate box
- Click the
Createbutton
- Run
system_uptime{object="nodes"}in vmui or in the explore view in Grafana to verify metrics from PVE are being sent to VictoriaMetrics. You should see 1 time series per node in your PVE cluster.
Proxmox Backup Server (PBS)
- Login to PBS as an administrator
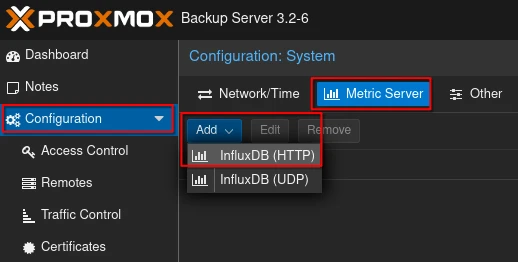
- Go to Configuration > Metrics Server > Add > InfluxDB
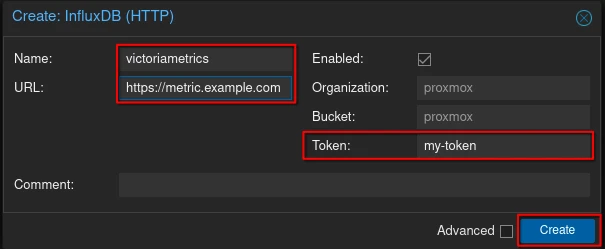
- Set the parameters as follows:
- Name: VictoriaMetrics (can be set to any string)
- URL: http(s)://<ip_or_host>:
- set the URL to https if you have TLS enabled and http if you do not
- Port: This will vary depending how you are sending data to VictoriaMetrics, but the defaults for all components are listed in the data ingestion documentation
- Organization: leave empty since it doesn't get used
- Bucket: leave empty since it doesn't get used
- Token: your token from vmauth or leave blank if you don't have authentication enabled
- Click the
Createbutton
- Run
cpustat_idle{object="host"}in vmui or in the explore view in Grafana to verify metrics from PBS are being to VictoriaMetrics.


