### Describe Your Changes

Updates and cross-references for `preset` mode of `vmanomaly` [in
docs](https://docs.victoriametrics.com/anomaly-detection/presets/)

### Checklist

The following checks are **mandatory**:

- [x] My change adheres [VictoriaMetrics contributing
guidelines](https://docs.victoriametrics.com/contributing/).

(cherry picked from commit 2184c0c730)
10 KiB
| sort | weight | title | menu | ||||||||
|---|---|---|---|---|---|---|---|---|---|---|---|
| 3 | 1 | Presets |
|
Anomaly detection presets
Please check the Quick Start Guide to install and run
vmanomaly
Presets are available starting from v1.13.0
Preset mode allows for simpler configuration and anomaly detection with vmanomaly on widely-recognized metrics, such as those generated by node_exporter, which are typically challenging to monitor using static threshold-based alerting rules.
This approach represents a paradigm shift from traditional static threshold-based alerting rules, focused on raw metric values, to static rules based on anomaly_scores. These scores offer a consistent, default threshold that remains stable over time, being adjusted for trends, seasonality, data scale, thus, reducing the engineering effort required for maintenance. Anomaly scores are produced by machine learning models, which are regularly retrained on varying time frames, ensuring alerts remain current and responsive to evolving data patterns.
additionally, preset mode minimizes user input needed to run the service. You can configure vmanomaly by specifying only the preset name and data sources in the reader and writer sections of the configuration file. All other parameters are already preconfigured.
Available presets:
Here is an example config file to enable Node-Exporter preset:
preset: "node-exporter"
reader:
  datasource_url: "http://victoriametrics:8428/" # your datasource url
  # tenant_id: '0:0'  # specify for cluster version
writer:
  datasource_url: "http://victoriametrics:8428/" # your datasource url
  # tenant_id: '0:0'  # specify for cluster version
Run a service using config file with one of the available options.
After you run vmanomaly with preset arg specified, available assets can be viewed, copied and downloaded at http://localhost:8490/presets/ endpoint.

Node-Exporter
Note: Preset assets can be also found here
For enabling Node-Exporter in config file use preset parameter:
preset: "node-exporter"
Generated anomaly scores
Machine learning models will be fit for each timeseries, returned by underlying MetricsQL queries. Anomaly score metric labels will also contain model classes and schedulers for labelset uniqueness.
Here's an example of produced metrics:
anomaly_score{for="cpu_seconds_total", instance="node-exporter:9100", preset="node-exporter", mode="system", model_alias="prophet", scheduler_alias="1d_1m"} 0.23451242720277776
anomaly_score{for="cpu_seconds_total", instance="node-exporter:9100", preset="node-exporter", mode="user", model_alias="prophet", scheduler_alias="1d_1m"} 0.2637952255694444
anomaly_score{for="page_faults", instance="node-exporter:9100", job="node-exporter", preset="node-exporter", model_alias="prophet", scheduler_alias="1d_1m"} 0.00593712535
anomaly_score{for="read_latency", instance="node-exporter:9100", preset="node-exporter", model_alias="mad", scheduler_alias="1d_1m"} 0.27773362795333334
anomaly_score{for="receive_bytes", instance="node-exporter:9100", preset="node-exporter", model_alias="mad", scheduler_alias="1d_1m"} 0.037753486136666674
anomaly_score{for="transmit_bytes", instance="node-exporter:9100", preset="node-exporter", model_alias="mad", scheduler_alias="1d_1m"} 0.17633085235
anomaly_score{for="write_latency", instance="node-exporter:9100", preset="node-exporter", model_alias="mad", scheduler_alias="1d_1m"} 0.019314370926666668
anomaly_score{for="cpu_seconds_total", instance="node-exporter:9100", preset="node-exporter", mode="idle", model_alias="mad", scheduler_alias="1d_1m"} 4.2323617935
anomaly_score{for="cpu_seconds_total", instance="node-exporter:9100", preset="node-exporter", mode="idle", model_alias="mad", scheduler_alias="2w_1m"} 1.5261359215
anomaly_score{for="cpu_seconds_total", instance="node-exporter:9100", preset="node-exporter", mode="idle", model_alias="prophet", scheduler_alias="2w_1m"} 0.5850743651
anomaly_score{for="cpu_seconds_total", instance="node-exporter:9100", preset="node-exporter", mode="idle", model_alias="z-score", scheduler_alias="1d_1m"} 1.6496064663
anomaly_score{for="cpu_seconds_total", instance="node-exporter:9100", preset="node-exporter", mode="idle", model_alias="z-score", scheduler_alias="2w_1m"} 0.924392581
anomaly_score{for="cpu_seconds_total", instance="node-exporter:9100", preset="node-exporter", mode="iowait", model_alias="mad", scheduler_alias="1d_1m"} 0.8571428657
...
Alerts
For optimal alerting experience, we include Awesome alerts to cover indicators not addressed by the preset, as static thresholds can effectively complement our machine learning approach.
Provided
vmanomalyalerts are set to fire only if all anomaly detection models vote that the datapoint is anomalous.
You can find corresponding alerting rules here:
vmanomalyAnomaly Detection alerts:http://localhost:8490/presets/vmanomaly_alerts.yml- Modified Awesome Alerts:
http://localhost:8490/presets/awesome_alerts.yml
Awesome Alerts replaced by Machine Learning alerts
- HostMemoryUnderMemoryPressure
- HostContextSwitching
- HostHighCpuLoad
- HostCpuIsUnderutilized
- HostCpuStealNoisyNeighbor
- HostCpuHighIowait
- HostNetworkReceiveErrors
- HostNetworkTransmitErrors
- HostUnusualNetworkThroughputIn
- HostUnusualNetworkThroughputOut
Grafana dashboard
Grafana dashboard .json file can be found here: http://localhost:8490/presets/dashboard.json
Indicators monitored by preset
The produced anomaly scores will have a label for containing the name of corresponding indicator.
| Indicator | Based on metrics | Description |
|---|---|---|
page_faults |
node_vmstat_pgmajfault |
Number of major faults that have occurred since the last update. Major faults occur when a process tries to access a page in memory that is not currently mapped in the process's address space, and it requires loading data from the disk. |
context_switch |
node_context_switches_total |
This metric represents the total number of context switches across all CPUs. |
cpu_seconds_total |
node_cpu_seconds_total |
Total amount of CPU time consumed by the system in seconds by CPU processing mode (e.g., user, system, idle). |
host_network_receive_errors & host_network_transmit_errors |
node_network_receive_errs_total, node_network_receive_packets_total, node_network_transmit_errs_total, node_network_transmit_packets_total
| Total number of errors encountered while receiving/transmitting packets on the network interfaces of a node. |
receive_bytes & transmit_bytes |
node_network_receive_bytes_total, node_network_transmit_bytes_total |
Total number of bytes received/transmitted on network interfaces of a node. |
read_latency & write_latency |
node_disk_read_time_seconds_total, node_disk_reads_completed_total, node_disk_write_time_seconds_total, node_disk_writes_completed_total |
Disk latency. The total read/write time spent in seconds. / The total number of reads/writes completed successfully. |
Example
Here's how attached Grafana dashboard can be used to drill down anomalies:
On the (global) graph 'Percentage of Anomalies', you can see a spike 8.75% of anomalies at the timestamp '2024-06-03 10:35:00'. The (global) graph 'Anomalies per Indicator' shows the indicators that were anomalous at the corresponding time.

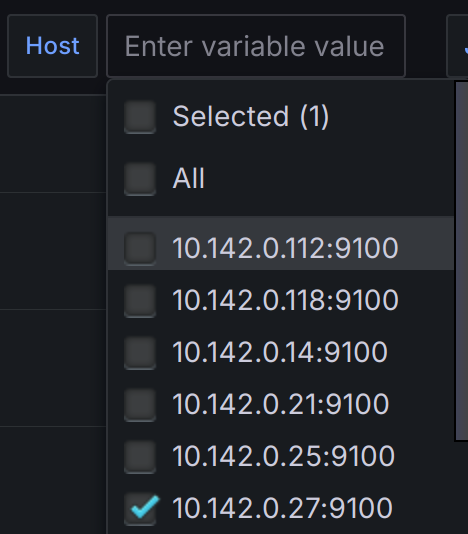
At this timestamp on the 'Number of Anomalous Indicators by Node' graph we can identify the node that had the most anomalies: 10.142.0.27

Now you can select anomalous node to drill down further (local):

For this node from the timestamp 2024-06-03 10:35:00 CPU time spent handling software interrupts started to grow.
(cpu_seconds_total{mode="softirq"})

At the same time cpu_seconds_total for steal mode started to grow as well.
