* deployment/logs-benchmark: add suite for Loki

Signed-off-by: Zakhar Bessarab <z.bessarab@victoriametrics.com>

* deployment/logs-benchmark: update go image to 1.21.3

Signed-off-by: Zakhar Bessarab <z.bessarab@victoriametrics.com>

* deployment/logs-benchmark: split command to run elk and loki

Signed-off-by: Zakhar Bessarab <z.bessarab@victoriametrics.com>

---------

Signed-off-by: Zakhar Bessarab <z.bessarab@victoriametrics.com>
3.8 KiB
Benchmark for VictoriaLogs
Benchmark compares VictoriaLogs with ELK stack and Grafana Loki.
Benchmark is based on:
- Logs from this repository - https://github.com/logpai/loghub
- logs generator
For ELK suite it uses:
- filebeat - https://www.elastic.co/beats/filebeat
- elastic + kibana
For Grafana Loki suite it uses:
How it works
docker-compose.yml contains common configurations for all suites:
- VictoriaLogs instance
- vmsingle - port forwarded to
localhost:8428to see UI - exporters for system metris
ELK suite uses docker-compose-elk.yml with the following services:
- logs generator which generates logs and sends them to filebeat instances via syslog
- 2 filebeat instances - one for elastic and one for VictoriaLogs.
- elastic instance
- kibana instance - port forwarded to
localhost:5601to see UI
Loki suite uses docker-compose-loki.yml with the following services:
- logs generator which generates logs and sends them rsyslog
- rsyslog instance - sends logs to Promtail
- Promtail instance - sends logs to Loki and VictoriaLogs
- Loki instance
Logs generator generates logs based on logs located at ./source_logs/logs and sends them to filebeat
instances via syslog.
Logs are generated by reading files line by line, adding randomized suffix to each line and sending them to filebeat via
syslog.
By default, generator will exit once all files are read. docker-compose will restart it and files will be read again
generating new logs.
Each filebeat than writes logs to elastic and VictoriaLogs via elasticsearch-compatible API.
How to run
- Download and unarchive logs by running:
cd source_logs
bash download.sh
Note that with logs listed in download.sh it will require 49GB of free space:
- 3GB for archives
- 46GB for unarchived logs
If it is needed to minimize disk footprint, you can download only some of them by commenting out lines in download.sh.
Unarchived logs size per file for reference:
2.3M Linux.log
 73M SSH.log
 32G Thunderbird.log
5.1M Apache.log
 13G hadoop-*.log
-
(optional) If needed, adjust amount of logs sent by generator by modifying
-outputRateLimitItemsandoutputRateLimitPeriodparameters in docker-compose.yml. By default, it is configured to send 10000 logs per second. -
(optional) Build victoria-logs image and adjust
imageparameter in docker-compose.yml:
make package-victoria-logs
Image name should be replaced at vlogs service in docker-compose.yml.
It is also possible to configure filebeat to send logs to VictoriaLogs running on local machine.
To do this modify filebeat config for vlogs and replace vlogs address
with address of local VictoriaLogs instance:
output.elasticsearch:
  hosts: [ "http://vlogs:9428/insert/elasticsearch/" ]
-
Choose a suite to run.
In order to run ELK suite use the following command:
make docker-up-elkIn order to run Loki suite use the following command:
make docker-up-loki -
Navigate to
http://localhost:3000/to see Grafana dashboards with resource usage comparison.Navigate to
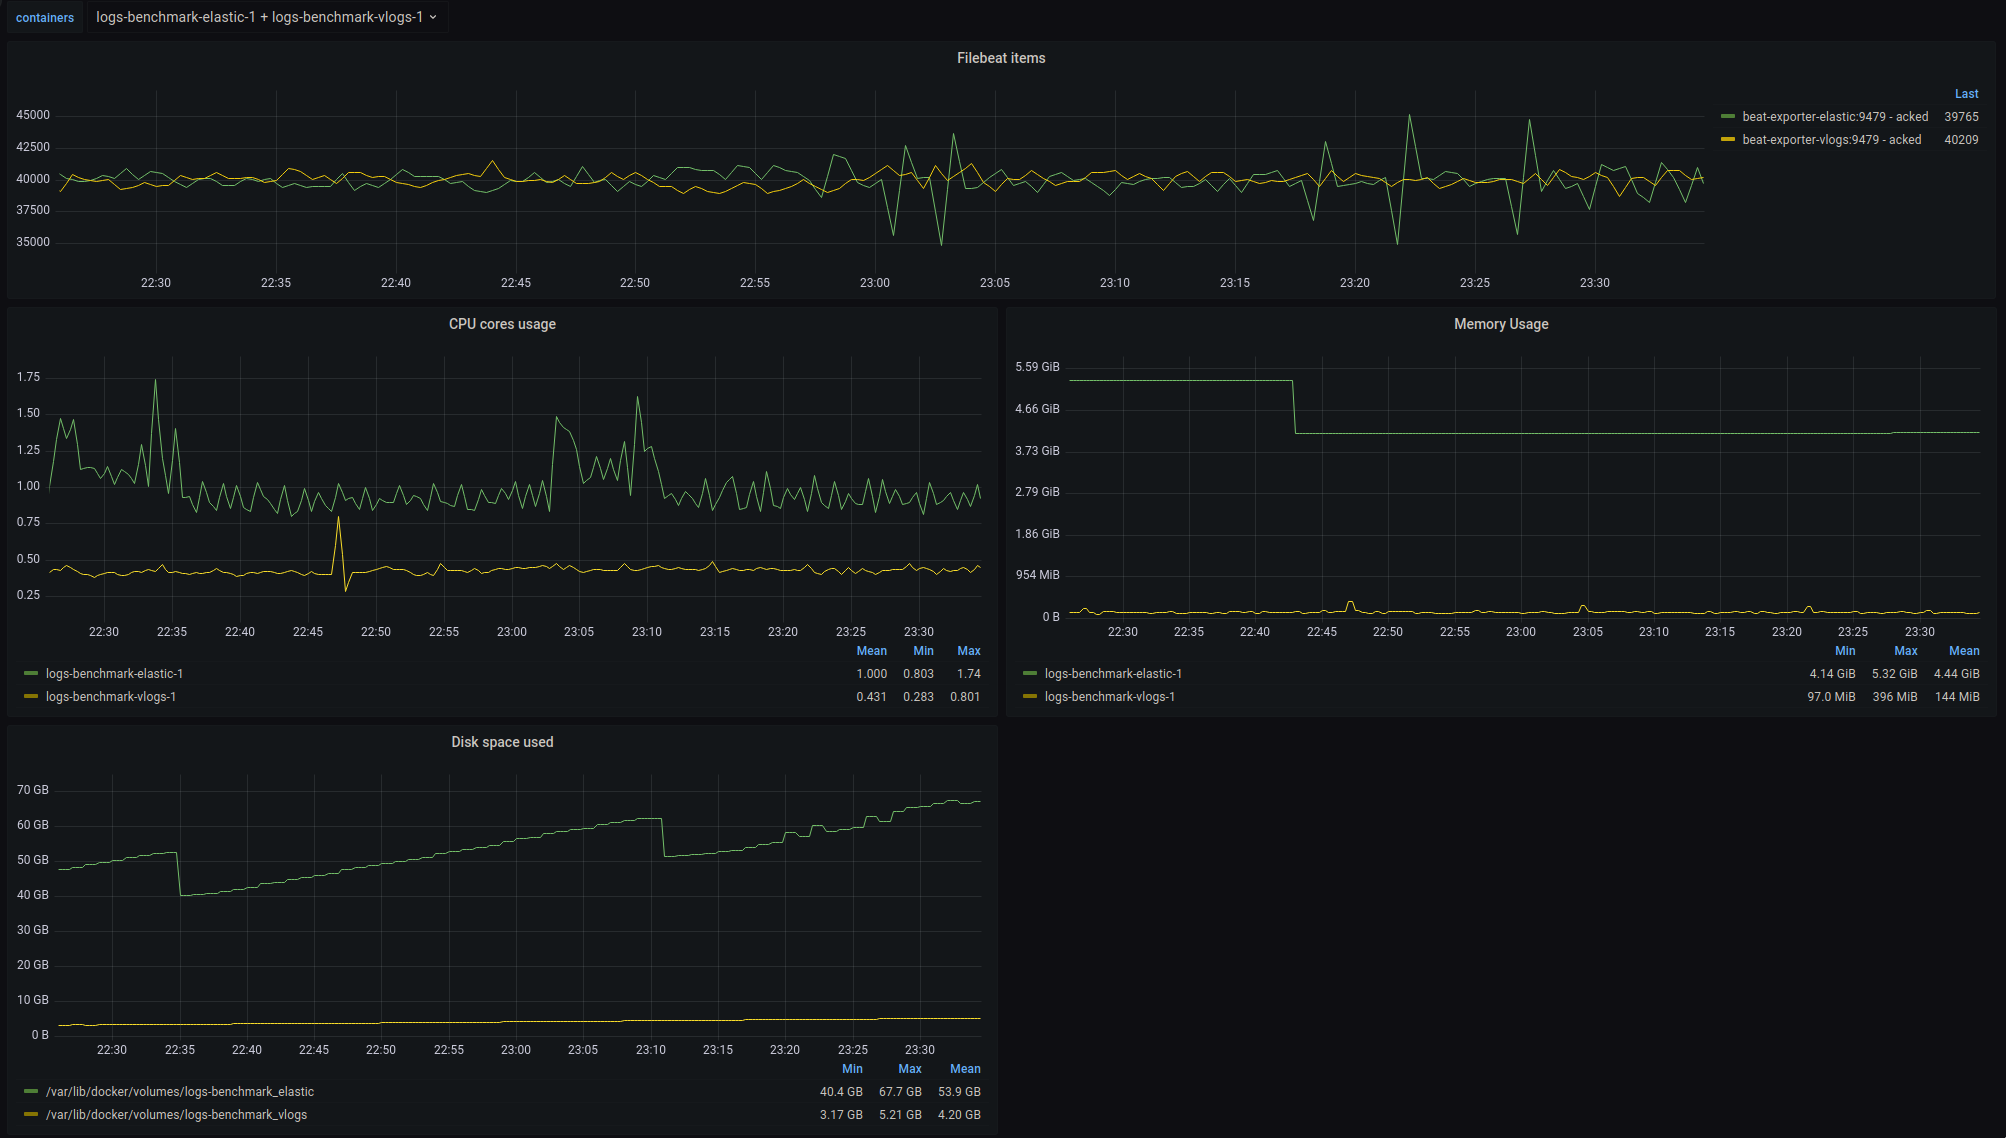
http://localhost:3000/d/hkm6P6_4z/elastic-vs-vlogsto see ELK suite results.Navigate to
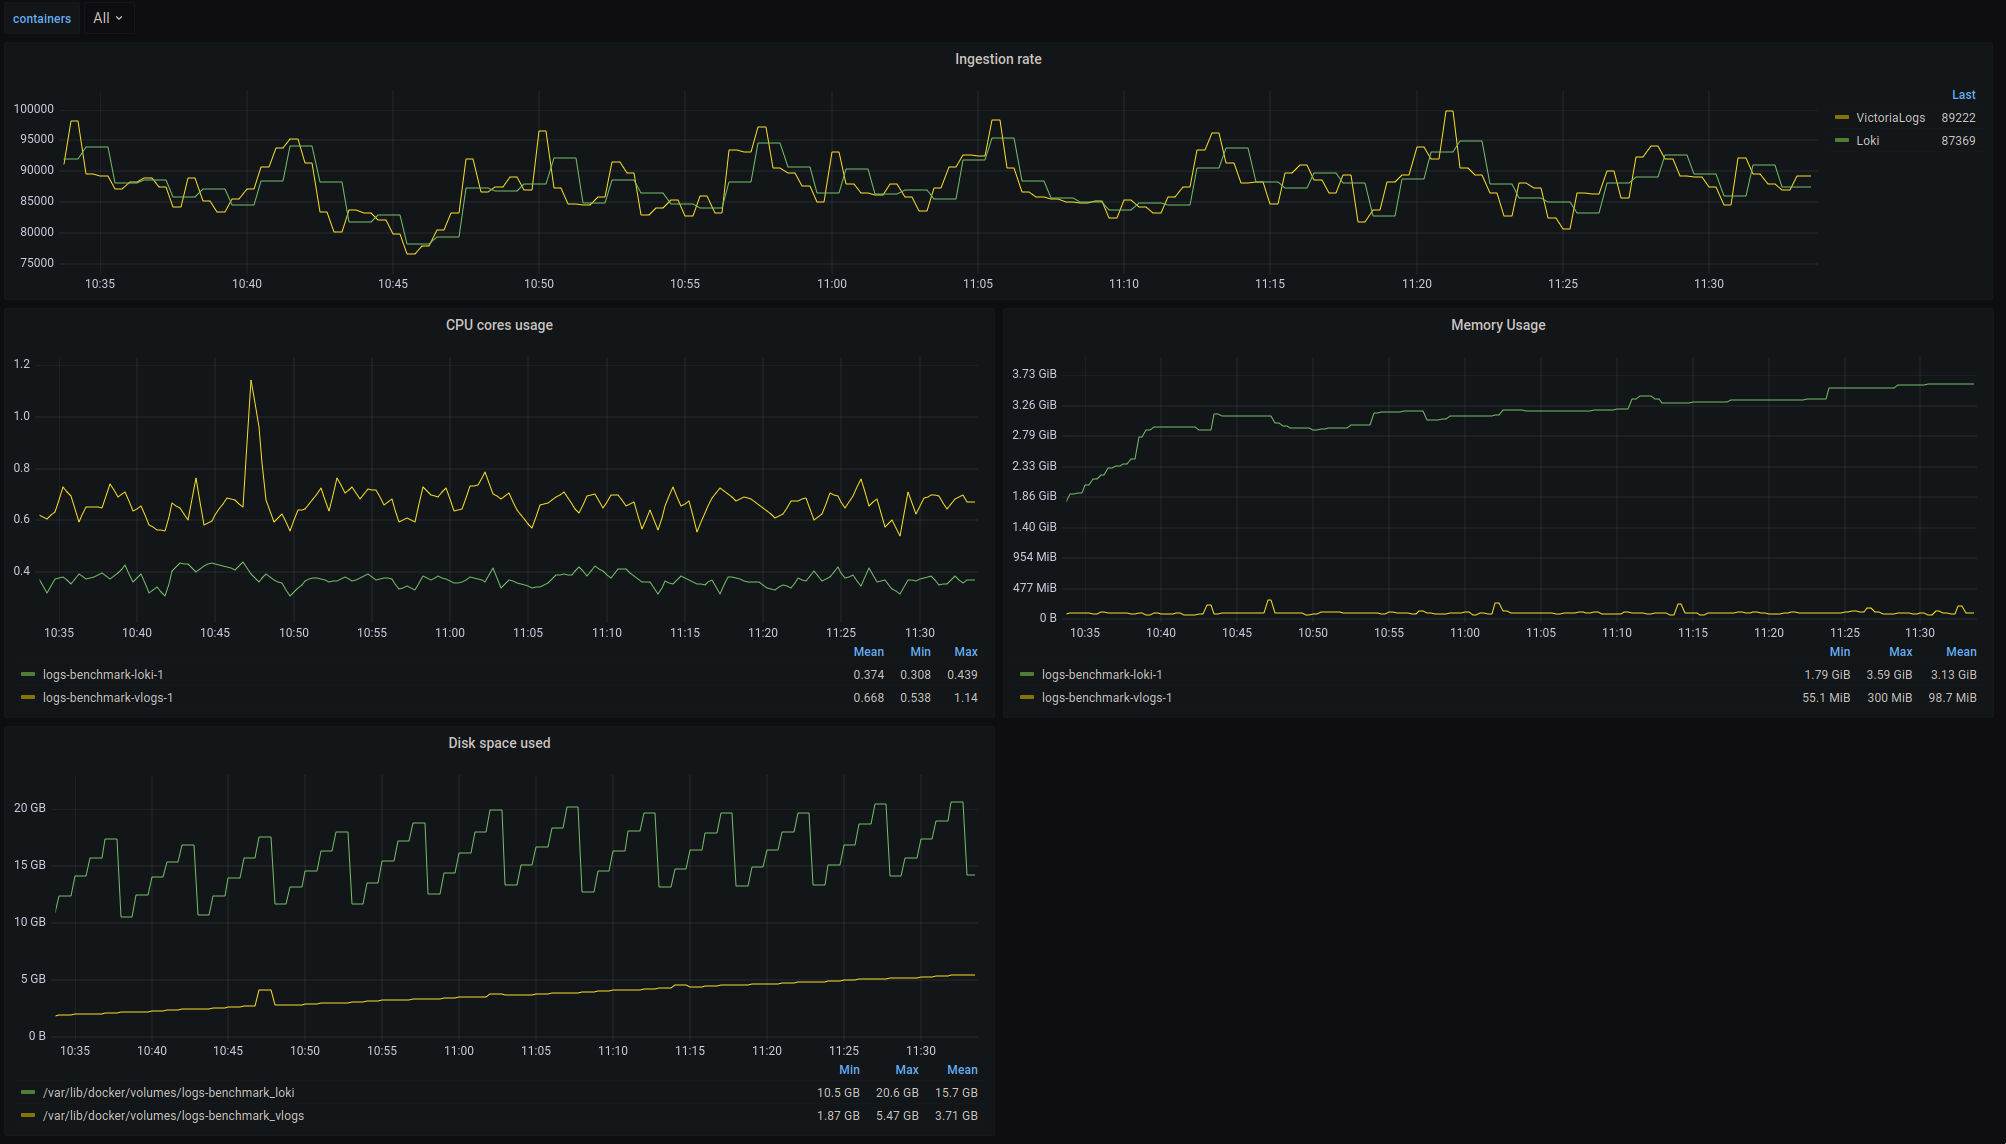
http://localhost:3000/d/hkm6P6_4y/loki-vs-vlogsto see Loki suite results.
Example results vs ELK:
Example results vs Loki:

